Bt Research, 2015, Vol.6, No.8, 1-15
3
the DNA standard (100 bp DNA ladder, Bioneer,
Korea) and the presence of 16 different bands (100,
150, 200, 225, 275, 300, 350, 400, 450, 500, 600, 700,
800, 900, 1000 and 1100 bp) were observed at varied
numbers and combinations in the strains. By
scrutinizing these bands, binary matrices for the
strains were obtained where the presence was scored
with 1 and absence with 0. No strain was observed
with all 16 bands and maximum 11 bands were
present for certain strains. Polymorphism based on
these 16 individual bands was calculated and 100%
polymorphism was not observed in any strain.
Maximum 68.8% polymorphism was seen in 0.4% of
the test strains whereas 25% polymorphism was most
prevalent followed by 31.3% (15.3% of test strains)
and 18.8% (13.1% of test strains) (Table 1).
As binary matrix was prepared for each strain based
on the 16 polymorphic DNA bands, 256 (16
2
)
numbers of different banding patterns are possible.
Therefore, 15 major RAPD pattern i.e. 15 genotyps
were presumed from all these binary matrices with
proximities to the major patterns which was derived
from the dendrogram based on the heights of the
clades (Fig 1- sup). Dendrogram (Fig 1- sup) was
constructed by UPGMA clustering method with the
distance matrix and simi larity matrix among
the strains prepared by dice coefficient
comparison method from their binary matrices i.e.
the numerical RAPD profiles (Table 1- sup). The
heights of the clades in scale bar, an indication
of distance among
Table 1 Prevalence of polymorphism at different level among the indigenous
Bt
strains.
Polymorphism (%)
6.3
12.5 18.8
25
31.3 37.5 43.8 50 56.3 62.5 68.8 75 81.3 87.5 93.8 100
Prevalence (%)
2.5
10.6 13.1 16.1 15.3 12.3 12.7 5.5 3.8 1.3 0.4
0
0
0
0
0
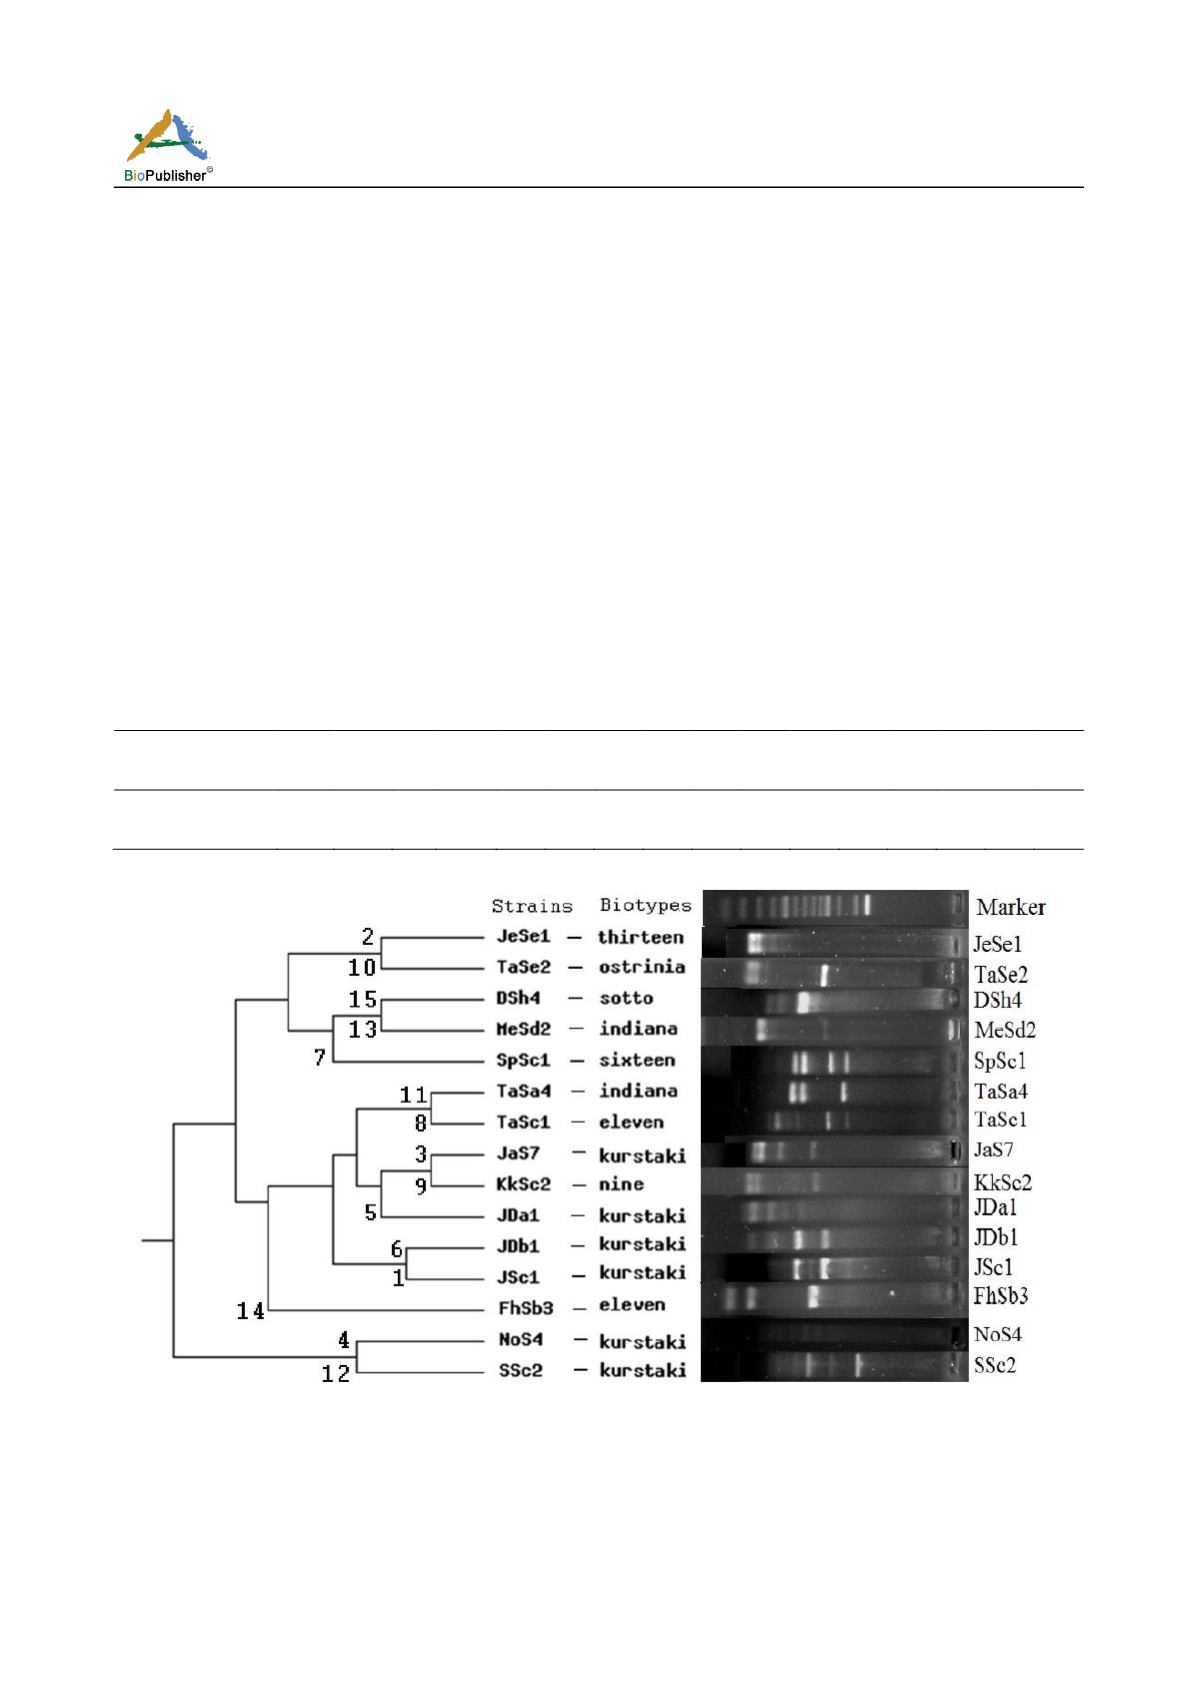
Fig. 1 Representative gel images showing random amplified polymorphic DNA (RAPD) genotypes (numbered 1- 15 in the left alignment
of the nodes) produced from
Bacillus
thuringiensis
strains with the primer OPA 03. (Marker: 100 bp DNA ladder, Bioneer, Korea).
the strains was standardized in this case. A middle
height at 0.2 was presumed as the threshold point
from the scale bar where the start point extended up to
0.45 to distinguish the major clusters as separate


