Molecular Plant Breeding 2016, Vol.7, No.29, 1
-
12
4
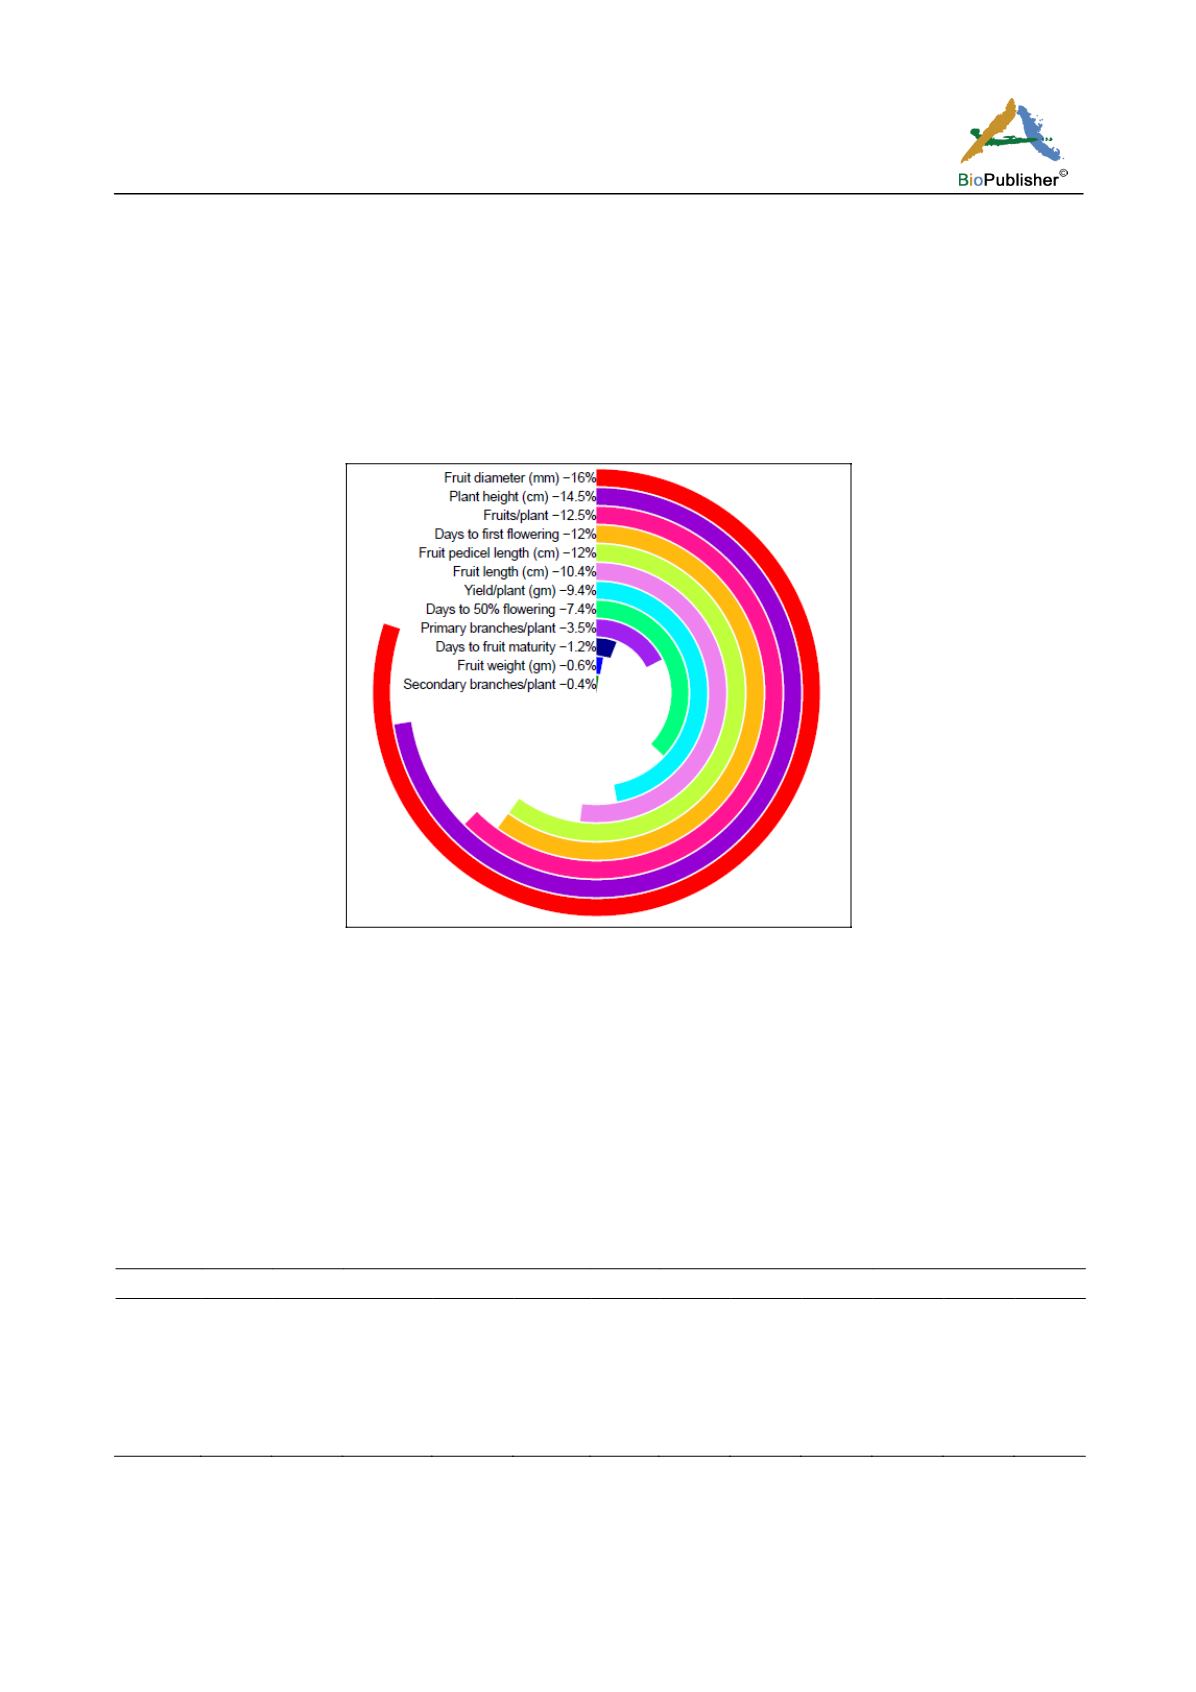
for fruit diameter (16%), plant height (14.5%), fruits/plant (12.5), days to 1
st
flowering (12), fruit pedicel length
(12%). Moderate contribution was found for fruit length (10.4%) and yield/plant (9.4%). Remaining characters
had very less contribution toward genetic diversity. Janaki et al. (2015) and Thul et al.
(2009) also observed that
fruit diameter had the maximum contribution toward genetic divergence in chili. The maximum contribution was
found in number of fruits per plant, yield per plant, fruit weight, fruit length and plant height towards divergence
in chili by Hasan et al. (2015), Srinivas et al. (2015); Karad et al. (2002); Varalakshmi and Babu (1991); Roy and
Sarma (1996), respectively. Therefore, the clusters having high values in these seven diverged characters could be
considered as superior cluster and the presence of most promising genotypes in them could be extensively used
for further breeding programmes to generate new recombinant chili lines.
Figure 2 Contribution of individual characters towards divergence.
1.4 Cluster mean analysis
Character wise mean were calculated for all the genotypes spread over six clusters (Table 2). Cluster VI showed
highest mean value for fruit diameter (14.04) and fruits per plant (219). Days to first flowering, days to 50%
flowering and days to fruit maturity were highest in cluster II. Cluster V showed highest mean value for yield per
plant (617.13) and fruit length (8.15). Cluster I had highest mean value for plant height and primary branches per
plant. Cluster IV did not show highest value for any character. Therefore, considering the cluster mean values
along with intercluster distances, it would be logical to say that the intercross between genotypes belonging to
more diverse clusters like cluster II and V, cluster I and VI and cluster II and VI will be effective to create wide
spectrum of variability and ultimately to produce transgressive segregants for chili.
Table 2 Cluster mean for various characters of 30 chili genotypes.
Cluster
PH
NPB
NSB
DFFL
D50%F DFM
FD
FL
FPL
FW
FP
YP
I
90.96* 5.34*
13.16
99.56
132.89
159.89 10.18
5.13
2.69
1.99
114.56 221.31
II
87.85
5.23
11.94
122.90* 159.00* 173.90* 9.49
4.94
2.65
1.25
80.50
101.01
III
68.98
5.19
14.40*
84.86
109.79
147.07 10.88
6.65
2.82*
3.90*
110.07 355.94
IV
82.59
5.25
13.16
102.44
133.89
160.29 10.18
5.57
2.72
2.38
101.71 226.08
V
72.51
5.34
13.00
83.00
105.00
143.50 7.05
8.15*
2.45
3.57
177.00 617.13*
VI
85.15
5.75
12.04
103.75
136.50
156.75 14.04* 4.43
2.41
2.26
219.00* 475.99
Note: PH= Plant height (cm), NPB/P= No of primary branches/plant, NSB/P= No. of secondary branches/plant DFFL= Days to first flowering,
D50%F= Days to 50% flowering, DFM = Days to fruit maturity, FD= Fruit diameter (mm), FL= Fruit length (cm), FPL= Fruit pedicle length (cm),
FW= Fruit weight (gm), FP= Fruits/plant, YP= Yield/plant (gm).
* = Highest mean value.


