International Journal of Marine Science 2016, Vol.6, No.01, 1-8
4
Table 2: Effect of phosphate (μM) on the growth of
Chaetoceros simplex
(Cell×10
4
·ml
-1
) (Each value is the mean ±SD)
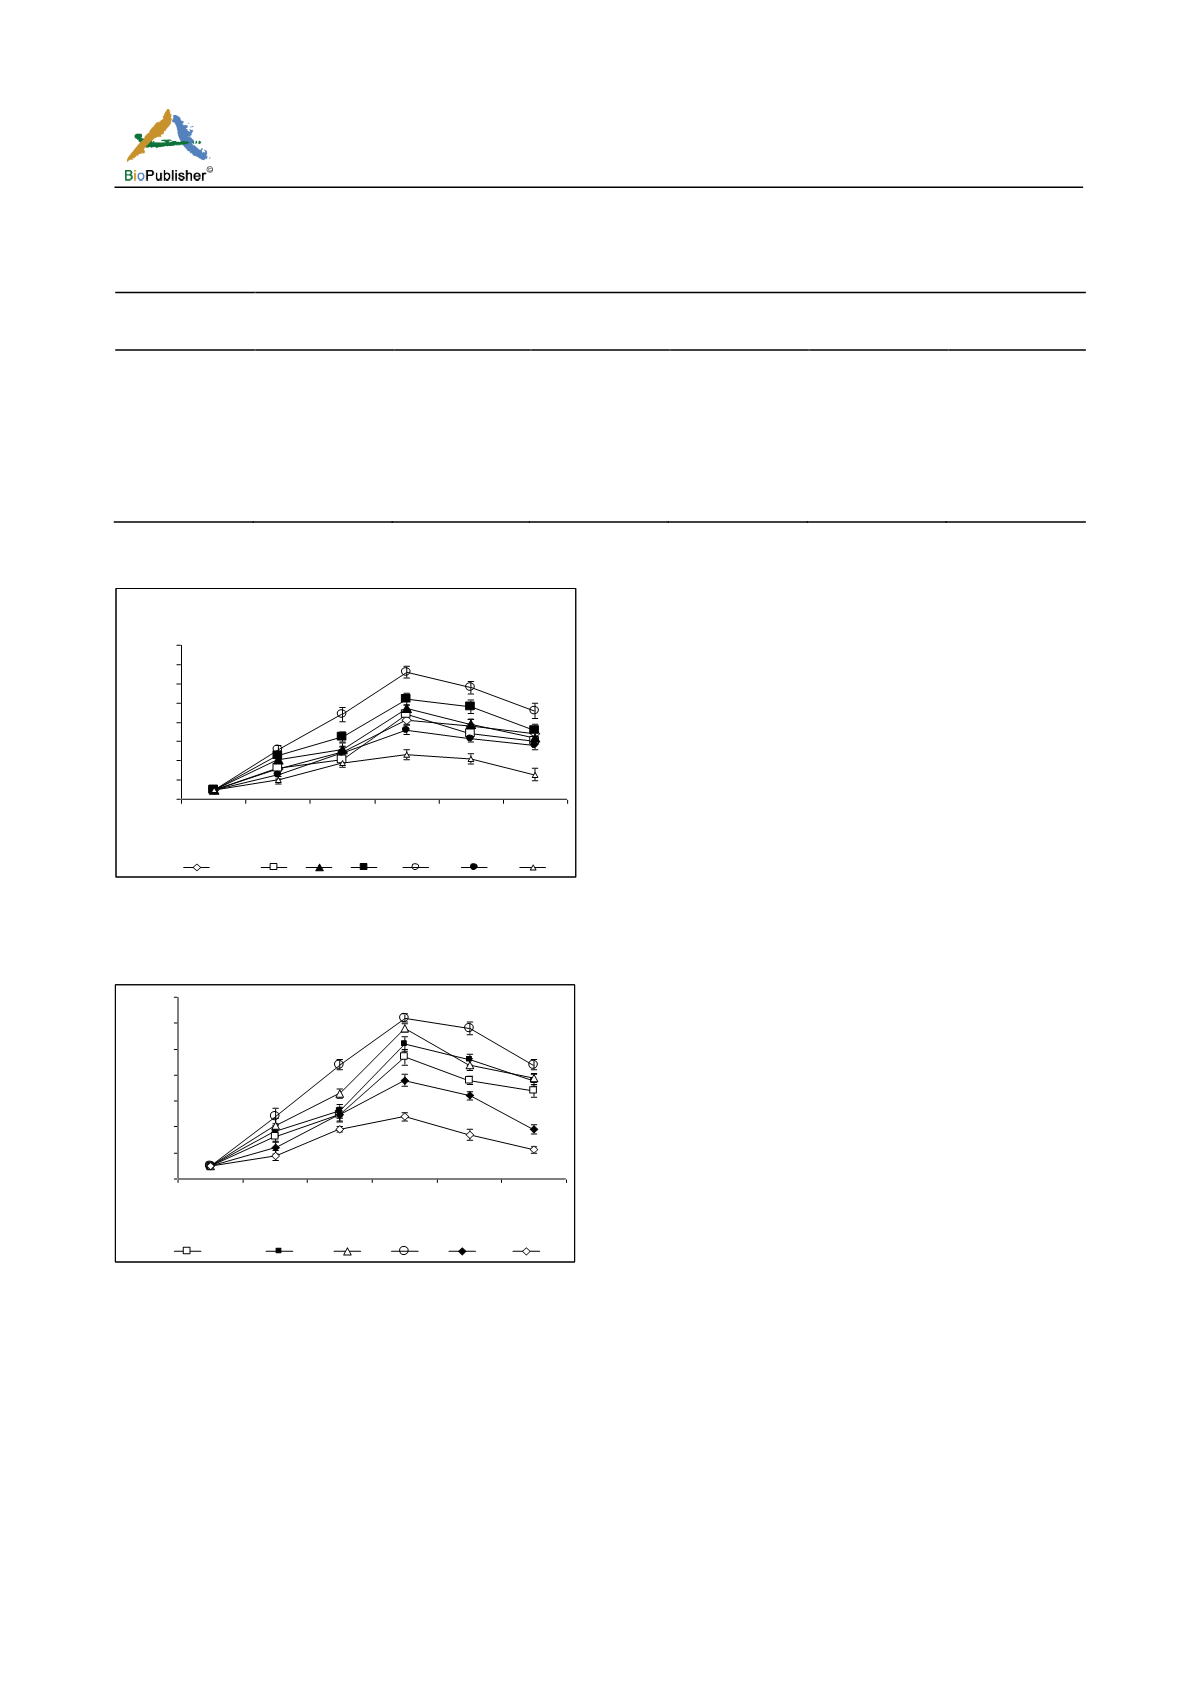
Fig. 2: Effect of different concentrations of nitrate (μM) on the
growth of
Chaetoceros simplex
(Cell×10
4
·ml
-1
) (Each value is
the mean ±SD)
Fig. 3: Effect of different concentrations of phosphate (μM)on
the growth of
Chaetoceros simplex
(Cell×10
4
·ml
-1
) (Each value is
themean ±SD)
maximum growth of
Chaetoceros simplex
330×10
4
cell·ml
-1
and 310×10
4
cell·ml
-1
were achieved at the
value of 100 μM nitrate and 5 μM phosphates. While,
the concentrations of 200 and 300 μM nitrate and 25
and 50 μM phosphate showed lower growth than the
other treatments. These nutrients are usually involved in
many biochemical reactions including proteins, nucleic
acids, chlorophylls and amino acids biosynthesis in the
photosynthetic organisms (Geider and La Roche, 2002;
Van Mooy et al., 2009 and Van Mooy et al., 2009).
However, the growth of
Chaetoceros simplex
decreased
gradually after eight days of incubation may due to the
expected gradual
decrease of nitrate and phosphate
concentrations w ith time as well as excretions of
unfavorable metabolites in the culture media. Padhi et
al. (2009)
reported that the maximum growth of
Chaetoceros curvisetus
was found
at 3 mM NaNO
3
and
slightly declined at 6 mM NaNO
3
. Hemalatha et al.
(2012) stated that the combination effect of temperature
and nutrients on
Chaetoceros simplex
, recording the
maximum cell density of 18.1×10
5
cells·ml
-1
at 20 ºC
under 1764 μM nitrate in the 10
t h
day of
c ulture, whereas at 25ºC and 29 ºC, the maximum cell
density reached 18.89×10
5
cells·ml
-1
and 23.5 ×10
5
cells·ml
-1
, respectively. Also, Hemalatha et al.
(2014)
found that the maximum cell density of
Chaetoceros
simplex
was reached in the culture treated with 1764
μM nitrate (18.23×10
5
cells·ml
-1
) and 72.4 μM
phosphate (18.21×10
5
cells·ml
-1
). The growth rate was
enhanc ed w ith increas ing of nutrients up to th e
concentration 2646 μM nitrate and 90.5 μM phosphates.
However, the concentrations of 1764 μM nitrate and
72.4 μM phosphate that pers istent the highes t cell
densities of
Chaetoceros simplex
by Hemalatha et al.
(2012, 2014) are extremely higher than recorded in the
present study. This may be due to the combination
effects of temperature and the nutrients ; nitrate,
phosphate and silicate in the culture F/2 media. This
result may be also due to the differenc es in the
environmental conditions, including salinity of seawater,
pH value, dissolved oxygen c onc entrations and
Day
Phosphate concentration (µM)
Control
0.3
1
5
25
50
0
25 ±5
25 ±5
25 ±5
25 ±5
25 ±5
25 ±5
2
81 ±10
92 ±11
102 ±15
121 ±12
60 ±10
45 ±6
5
123 ±13
130 ±13
164 ±9
220 ±13
124 ±6
95 ±10
8
235 ±15
260 ±14
290 ±8
310 ±12
190 ±8
120 ±12
10
190 ±8
230 ±10
220 ±12
290 ±8
160 ±10
85 ±15
12
170 ±12
190 ±12
195 ±9
220 ±9
95 ±6
56 ±7
Nitrate
0
50
100
150
200
250
300
350
400
0
2
5
8
10
12
Days
Growth (cell x 10
4
.ml
-1
)
Control
1
5
50
100
200
300
Phosphate
0
50
100
150
200
250
300
350
0
2
5
8
10
12
Days
Growth (cell x 10
4
.ml
-1
)
Control
0.3
1
5
25
50


