International Journal of Marine Science 2016, Vol.6, No.01, 1-8
3
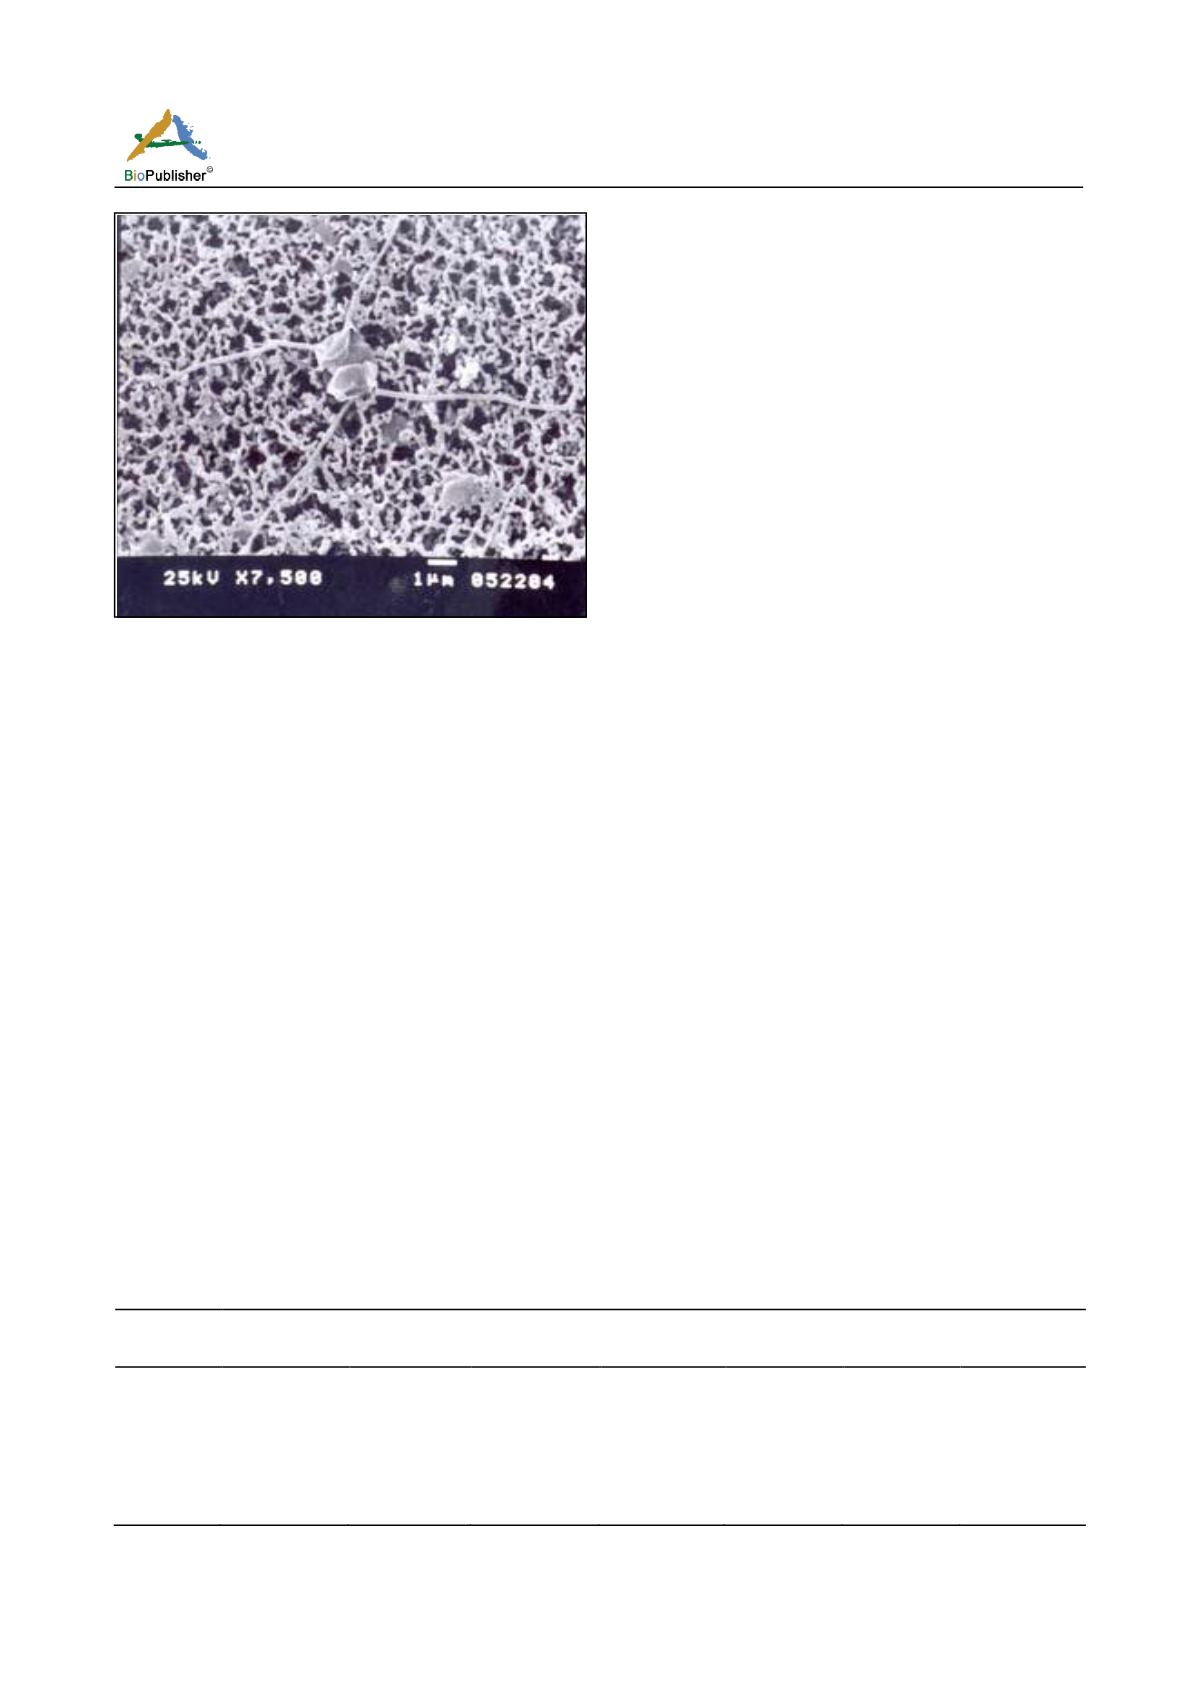
Fig 1 Scanning electron micrograph of
Chaetoceros simplex
Ostenfeld (Ashour, 2011)
Determination of growth
Algal cells were counted every 48 hours intervals with
haemocytometer (0.1 mm depth) under a binuc lear
research microscope with a magnification power of
480x and the counts were expressed as cells·ml
-1
.
Determination of different metabolic variables
The chlorophylls (
a
and
c
) were estimated according to
the method recommended by Parsons and Strickland
(1965). The total carbohydrate content was measured
by the phenol-sulphuric ac id method (Herbert et
al., 1971). Total soluble protein was determined
quantitatively using the method described by Lowry et
al. (1951). The total lipids of algal cells were extracted
ac c ording to Bligh and Dyer (1959).
Statistical Analysis
The ANOVA analys is was carried out for the
obtained data on the computer us ing the program of
STATISTICAat p < 0.01
.
Results and Discussion
The chemical well as to the experimental conditions
applied like temperature, light content of microalgae
can vary with culture age and with changes in culture
conditions (Araújo and Garcia, 2005). The effect of
variation of these parameters on many algal species has
been studied by several workers (Uriarte et al., 1993;
El-Sherif, 1993; Hemalatha et al., 2012, 2014;
Abdel-Hamid et al., 2015). Data on the chemical
composition of microalgae may also varywidely due to
differenc es of the methods of measurement used
(Barbarino and Lourenço, 2005); the physiological state
of the microalgae, as intensity, medium cultivation or in
outdoors conditions (Banerjee et al., 2011). In addition,
due to the interaction of the organisms with the culture
medium, a batch culture is under a continuous chemical
change. These variations reflect on the cell metabolism
and consequently on their chemical composition
(Lourenço et al., 2002).
Growth of
Chaetoceros simplex
Nutrients are among the most important factors
controlling phytoplankton growth. However, nutrient
contents in marine environments greatly change over
space and time (Eker-Develi et al., 2006).
In the present
study,
the concentrations of 1, 5, 50 and 100 μM of
nitrate stimulated the algal growth of
Chaetoceros
simplex
by 7, 14, 26 and 60%, respectively over the
control culture in the 8
th
day of culture. While, the
values of 200 and 300 μM nitrate caused about 13 and
44 % growth reduction, respectively below the control
culture. On the other hand, phosphate concentrations
of 0.3, 1 and 5μM s timulated the grow th of
Chaetoceros simplex
by 11, 23 and 32 %, respectively,
while, the v a lues of 25 and 50 μM exh ib ited a
dec reas e in the algal growth by 19 and 49 %,
respectively (Tables 1, 2 and Figs.2, 3). In general, the
Table 1 Effect of nitrate (µM) on the growth of
Chaetoceros simplex
(Cell×10
4
·ml
-1
) (Each value is themean ±SD)
Day
Nitrate concentration (μM)
Control
1
5
50
100
200
300
0
25 ±5
25 ±5
25 ±5
25 ±5
25 ±5
25 ±5
25 ±5
2
78 ±13
81 ±12
103 ±13
113 ±11
128 ±11
64 ±7
50 ±10
5
123 ±15
102 ±15
130 ±16
162 ±13
220 ±3
120 ±8
95 ±12
8
206 ±12
220 ±11
235 ±10
260 ±15
330 ±15
180 ±8
115 ±13
10
190 ±18
170 ±8
195 ±12
240 ±17
290 ±10
157 ±9
105 ±14
12
170 ±17
150 ±13
160 ±8
180 ±14
230 ±7
140 ±8
64 ±16


