International Journal of Marine Science 2016, Vol.6, No.01, 1-8
6
Fig 7 Effect of different concentrations of phosphate (μM) on
the chlorop hy ll-c (μg·ml
- 1
) of
Chaetoceros simplex.
(Each value is themean ±SD)
Fig 8 Effect of different concentrations of nitrate (μM) on the
carotenoids (μg·ml
-1
) of
Chaetoceros simplex
(Each value is the
mean ±SD)
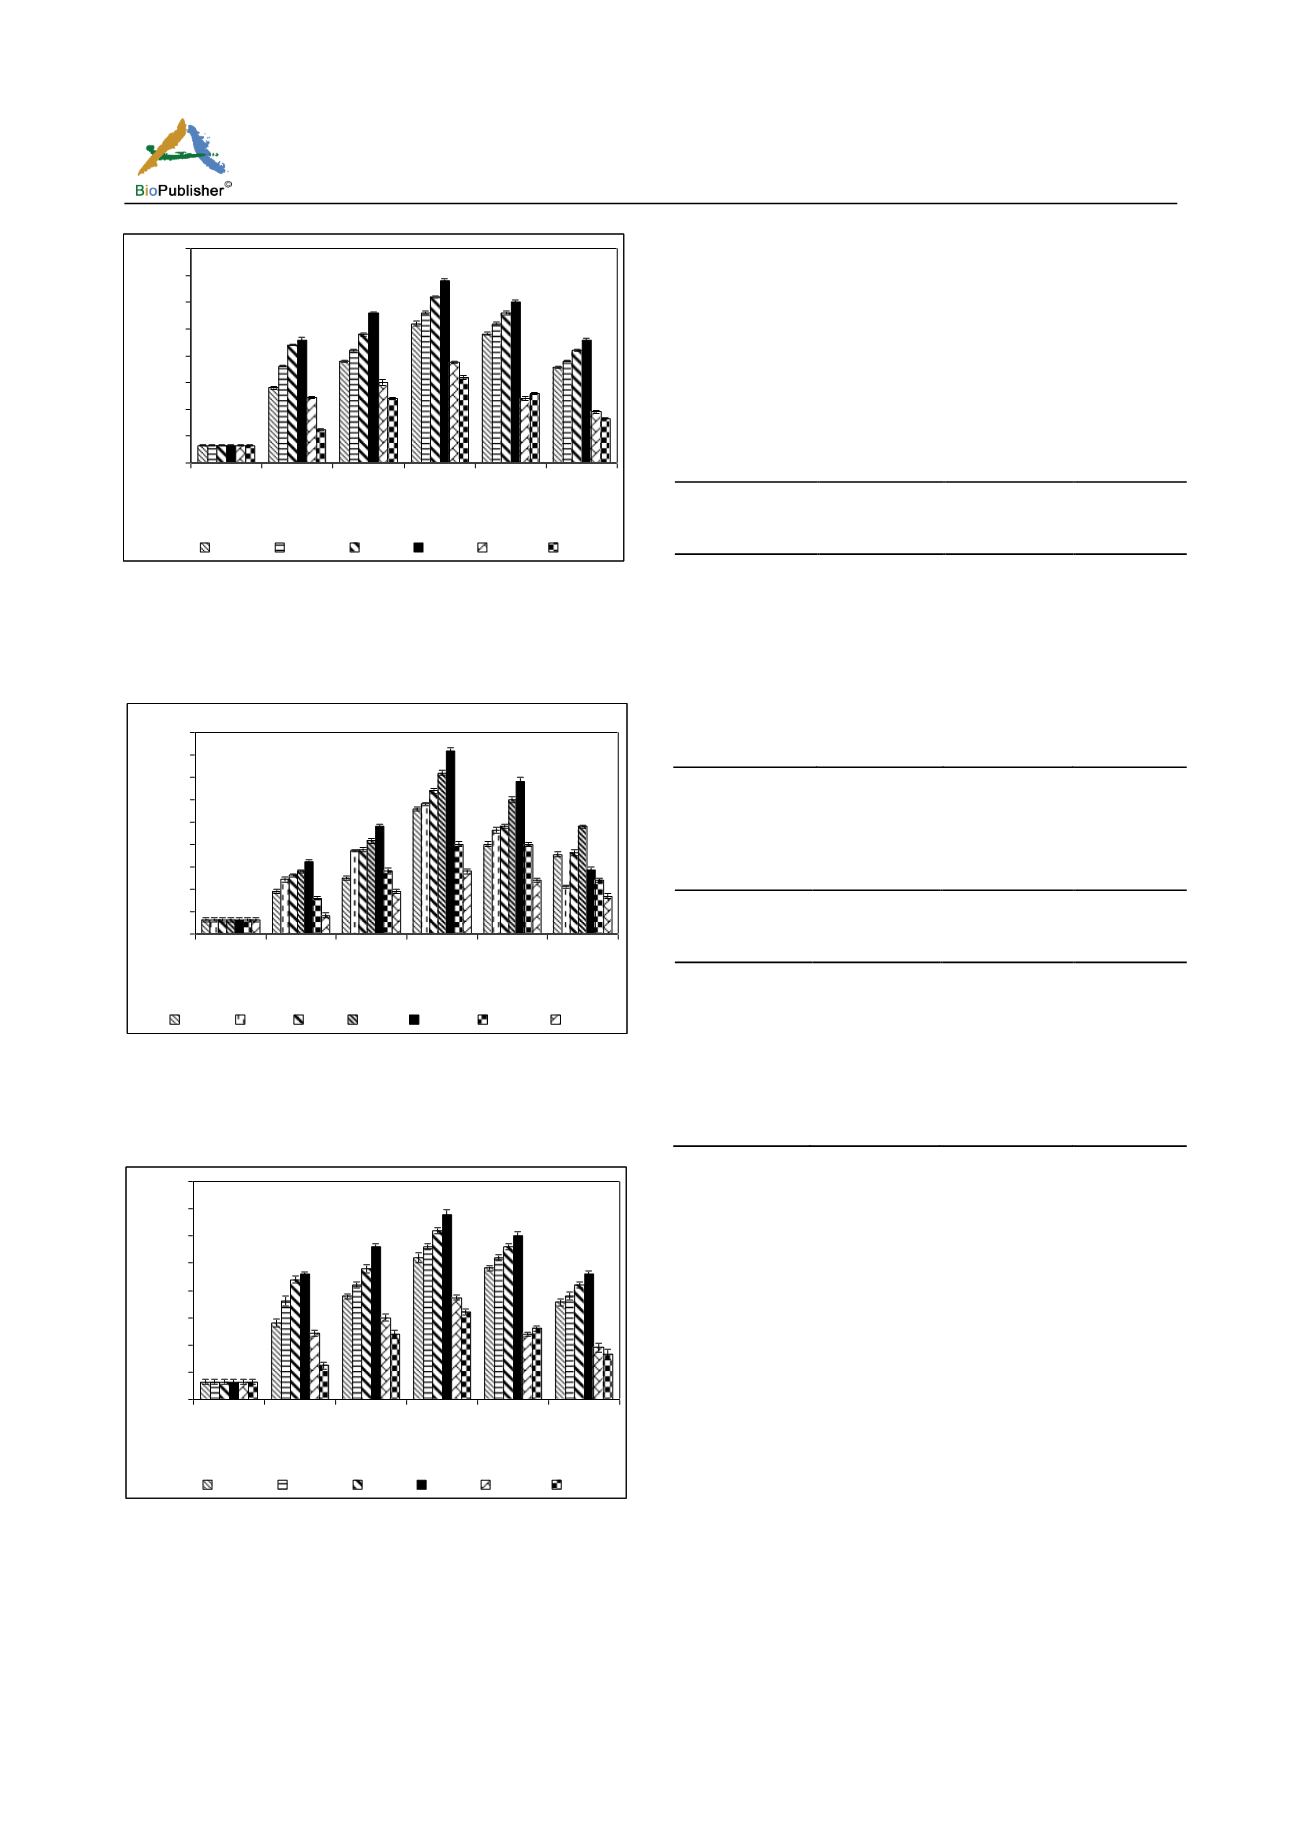
Fig 9 Effect of different concentrations of phosphate (μM) on
the carotenoids (μg·ml
-1
) of
Chaetoceros simplex
(Each value is
the mean ±SD)
et al. (2014) indic ated that protein c ontent of
Chaetoceros simplex
showed the maximum values at
2205 μM nitrates and 90. 5 μM phosphates
.
It is
generally rec ognized that the protein c ontent of
microalgae depends on the amount of nitrogen
available in the culture medium; an increase in nitrogen
concentration in the medium may increase the cellular
protein content of the organism (Li et al., 2005).
Table 3: Effect of different concentrations of nitrate (μM) on the
total carbohydrates, total soluble proteins and total lipids (μg·ml
-1
)
of
Chaetoceros simplex
(Each value is themean ±SD)
Nitrate
Concentrations
Total
carbohydrate
Total soluble
proteins
Total lipids
Control
35.5 ±1.3
5.7 ±0.5
86 ±5
1
37.4 ±2.5
6.2 ±0.9
84.2 ±3
5
40.3 ±1.5
6.9 ±0.7
78.2 ±7
50
41.6 ±3.5
7.4 ±1.7
65 ±20
100
50 ±5.3
7.8 ±2.6
60.2 ±10
200
34.2 ±2.9
3.88 ±0.34
50.4 ±18
300
21.4 ±2.8
3.79 ±0.76
46.3 ±15
Table 4 Effect of different concentration of phosphate (μM) on
the total carbohydrates, total soluble proteins and total lipids
(μg·ml
-1
) of
Chaetoceros simplex
(Each value is themean ±SD)
Phosphate
concentration
Total
Carbohydrate
Total soluble
proteins
Total lipids
Control
35.5 ±1.3
5.7 ±0.9
86 ±5
0.3
43.2 ±3.2
6.6 ±0.8
80.7 ±11
1
47.4 ±2.2
7.2 ±0.6
69.2 ±7
5
54.6 ±3.5
7.5 ±2.2
50.3 ±5
25
38.5 ±5.3
4.9 ±0.7
44.2 ±7
50
28.6 ±1.6
3.55 ±0.67
40 ±3
Carbohydrates
The main storage compounds of diatoms are lipids
(TAGs) and a β-1, 3-linked carbohydrate known as
chrysolaminarin, which are sun light driven cell
factories that convert carbon dioxide to potential
biofuels, foods and feeds (Walter et al., 2005). In the
present study, the carbohydrates showed increasing
trends with increase of nitrate and phosphate in the
culture media up to 100 μM nitrate and 5 μM
phosphates and then it gradually decreased. The
addition of 5 μM phosphate to the culture medium of
Chaetoc eros s implex rec orded a max imum
carbohydrate of 54.6±3.5 μg·ml
-1
and the addition of
100 μM nitrate sus ta ined the h igh es t valu e o f
50±5.3μg·ml
-1
. Whereas, the minimum carbohydrate
content was observed with the concentrations of 300
μM nitrate and 50 μM phosphate (Tables 3 and 4).
Phosphate
0
0.5
1
1.5
2
2.5
3
3.5
4
0
2
5
8
10
12
Days
Chlorophyll-c (μg.ml
-1
)
Control
0.3 μM 1 μM 5 μM 25 μM 50 μM
Nitrate
0
0.5
1
1.5
2
2.5
3
3.5
4
4.5
0
2
5
8
10
12
Days
Carotenoid (μg.ml
-1
)
Control 1 μM
5 μM 50 μM 100 μM 200 μM
300 μM
Phosphate
0
0.5
1
1.5
2
2.5
3
3.5
4
0
2
5
8
10
12
Days
Carotenoid (μg.ml
-1
)
Control
0.3 μM 1 μM 5 μM 25 μM 50 μM


