Basic HTML Version


International Journal of Marine Science 2014, Vol.4, No.20: 183-193
http://ijms.sophiapublisher.com
187
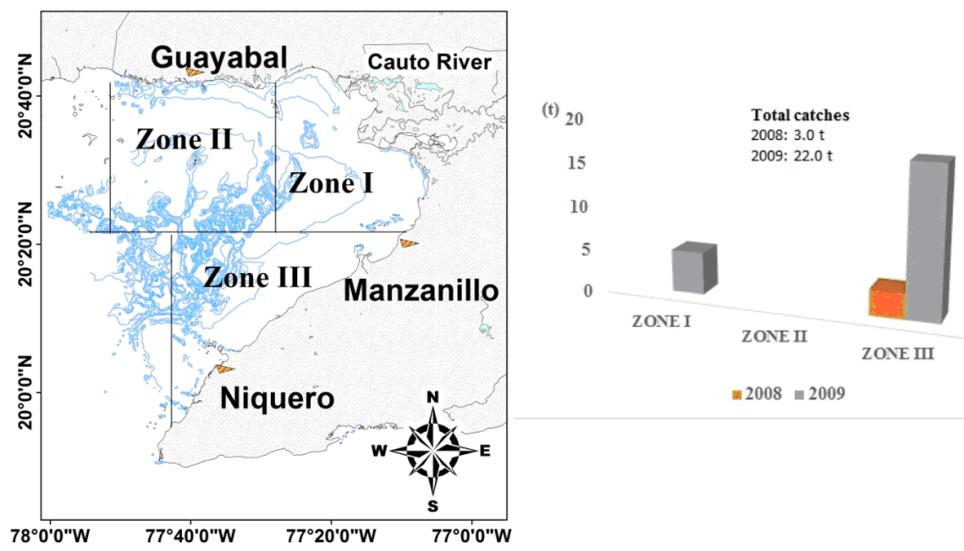
Figure 5 Total catches (t) of the pink shrimp in three fishing zones in 2008 and 2009. Zone I and II belong to the North region and
zone III to South region of Guacanayabo’s Gulf.
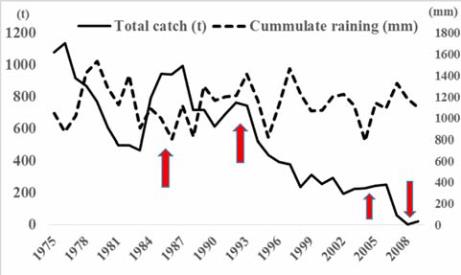
Figure 4 Annual catches of pink shrimp in Guacanayabo’s Gulf
from 1975-2009. Arrows indicate main handling fisheries
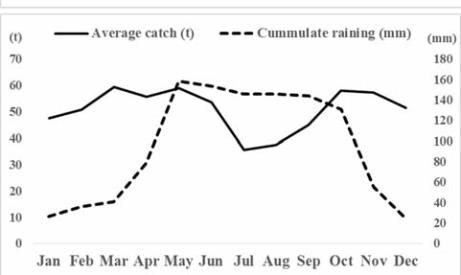
policies to protect the fishing resource. Monthly mean catch of
pink shrimp and monthly local cumulate raining in
Guacanayabo’s Gulf
1.2 Spatial variability of water quality parameters
Spatial water temperature distribution was in
agreement with seasonality and diurnal cycle
influence. The isothermal lines allow discriminating
higher values through the North region of the Gulf and
from remote areas from river systems (Figure 6).
Highest values and gradients were shown in summer,
with lowest values in the interchange region among
the gulf water and adjacent sea. On the other hand, the
autumn reflected most homogeneity in horizontal
distribution and lowest reported values (Figure 6).
The horizontal salinity variation reveals a gradual
increase of values through the North and Norwest
regions (Figure 7). The maximum salinity values were
found during spring season (dry season) in the
subzones away from the mouth of the rivers and the
open sea. Minimal salinities were registered in
adjacent subzones to the mouth of the rivers and in fall
(transition rainy- dry season), and that period showed
highest variations in isolines (Figure 7).
Spatial variability of dissolved oxygen indicates that
during the sampling time, most of the platform waters
reflect a relative uniform oxygenation (Figure 8). The
maximum values are always displayed in the northern