Basic HTML Version


International Journal of Marine Science 2014, Vol.4, No.20: 183-193
http://ijms.sophiapublisher.com
186
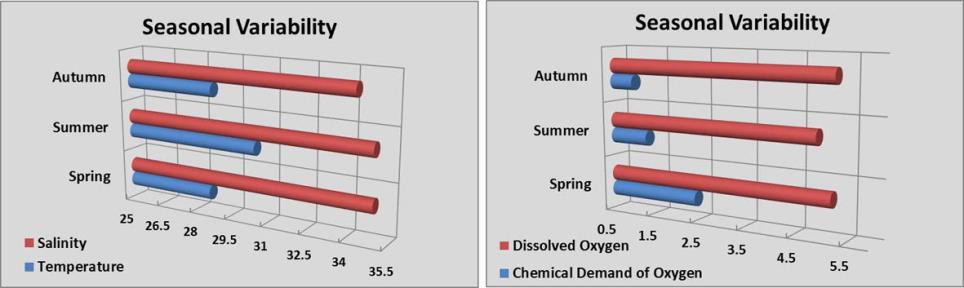
Mean water temperature in Guacanayabo´s gulf was
29.5
℃
and the monthly variation was in accordance
with each season period. Extreme values moved
between maximum of 32.8
℃
(August 2008) and
minimum of 24.8
℃
(November 2008). The seasonal
cycle of the monthly means decreased to the minimum
in autumn and increased to the maximum in summer
(Table 2). On the other hand, salinity had similar
averages for all seasons of the year (Figure 3), as well
as their maximum values (Table 2). The extremes had varia-
tions among 30 psu and 36 psu registered in autumn
(September 2008), with general mean of 34.8 ± 0.96 psu.
Table 2 Variation of physical parameters for different climatic seasons in Guacanayabo´s Gulf for 2008-2009 period.
Spring
Summer
Autumn
Marker
Unit
Min. Max. Mean
Stand.
Dev.
Min. Max. Mean
Stand.
Dev.
Min. Max. Mean
Stand.
Dev.
Temp.
℃
26.7 31.0
28.6
1.1
29.1 32.8
30.5
0.7
24.8 31.5
28.7
1.9
Salinity
psu
31.5 36.5
34.9
0.9
31.2 36.0
34.9
0.8
30.2 36.6
34.3
1.0
DO
mg/L
3.3
6.7
5.2
0.8
2.9
6.4
4.9
0.9
3.7
6.6
5.3
0.64
DO
%
56.2 110.0 82.7
13.7
50.4 104.5 81.4
13.4
42.7 104.8 83.1
9.59
COD
mg/L
0.1
6.2
2.3
1.2
0.2
3.6
1.3
0.8
0.3
2.2
1.0
0.4
Figure 3 Seasonal distribution of hydrological parameters in Guacanayabo´s Gulf. Sampled values were in relation with seasonality
of precipitations and the evaporation rate.
The average dissolved oxygen concentration (DO)
was 5.10 ± 0.82 mg/L, with extreme values of 2.9
mg/L (August 2008) and 6.7 mg/L (May).
Extreme values of COD were among 0.01 (May 2008)
and 6.2 mg/L (May 2009), for a general mean of
1.6±1.1 mg/L. Extreme values are from spring time,
while in summer the highest standard deviations are
presented (Table 2). Seasonal variability show least values
in autumn and maxima in spring season (Figure 3).
1.1.3 Variability in pink shrimp catches.
The maximum of captures of pink shrimp in
Guacanayabo’s gulf was in 1976 (1187 t). After that
there is a decline until a minimum in 2008 (3.0 t).
However in 2009 an increase tendency is noted (22.0 t)
in the gulf. The analysis of the historical series,
indicates a clear improve in catches once any regulation
policy (1983, 1990, 2001, 2008) has been accomplished
(Figure 4).
Both the annual capture and annual precipitation (R²=
-0.11; P=0.52) or monthly capture with monthly
precipitation (R² = -0.15; P=0.002) do not correlated
each other.
Total catches values per zone for 2008 and 2009 show
higher values for the south region (zone III) in relation
to the north (zone I and II). It is necessary to remark
that in the zone II, at the north part of Guacanayabo’s
Gulf, there was a regulation fishing ban for the pink
shrimp protection due to the little values of biomass
the years before (Figure 5).