Basic HTML Version


International Journal of Marine Science 2013, Vol.3, No.34, 267-277
http://ijms.sophiapublisher.com
270
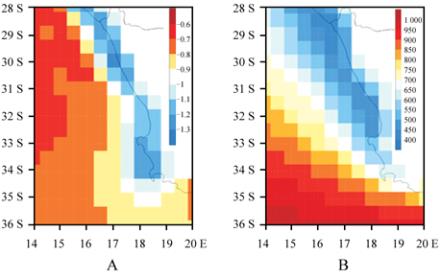
The CFS reanalysis product exhibits a narrow band
of cyclonic wind vorticity (or curl) and low mixed
layer height along the west coast of South Africa
(Figure 3a, b) due to negative heat fluxes over the
upwelling zone (Jury and Reason, 1989). Coastal
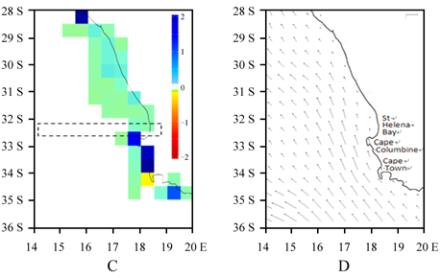
upwelling is represented in SODA by 1-100 m vertical
motion >1m/day between 17-18°E from 28-34°S
(Figure 3c). SODA 1-100m currents are equatorward
and exhibit marked shear ∂V/∂x over the shelf edge
(Figure 3d). Many lower resolution products (GODAS)
do not resolve the coastal upwelling and longshore jet
next to Cape Columbine 33°S. Higher resolution
products like CFS and SODA capture the narrow wind
jet that amplifies offshore Ekman transport via shear
of the mean flow.
Figure 3 CFS mean annual: a) absolute wind vorticity (x10
-4
s
-1
cyclonic - negative), and b) atmospheric mixed layer
height (m). SODA mean annual 1-100 m depth-averaged: c)
vertical motion (m/day), and d) currents (m/s) with largest
vector ~0.1 m/s
Note: Dashed area in c) refers to sections in Figures 4,5,6. Key
place names given in d). All averaged 1980-2008
3.2 Zonal sections and annual cycle
Analysis of SODA ocean climatology on a 1-500 m
depth section at 32.5°S illustrates the zonal
overturning upwelling circulation (Figure 4a). While
there is no sign of onshore flow at depth (unlike
Veitch et al., 2010 Figure 14b), upward motion is
prevalent east of 15°E and joins the offshore flow
above 300m. Isotherms reflect moderate stratification
over the shelf edge and a slope of 10
-4
near the coast
(Figure 4b) comparable to WOA, but greater than
GODAS and less than Veitch et al (2010). Standard
deviations >1
℃
are found above 60m depth in two
longitude bands: 14-16°E and 18°E (Figure 4d). Sea
temperature variance is <0.2
℃
on the shelf below
300m from 16-17.5°E and in the upper layer near the
coast, both under-represented. There is an equatorward
current >0.1 m/s extending from 1-100 m depth in the
longitudes 16-17.5°E (Figure 4c) consistent with
measurements of Bang and Andrews (1974) and
Veitch et al (2010, Figure 14a). Maximum near-surface
equatorward currents in SODA of 0.17 m/s around
17°E compare with a co-located 0.22 m/s in Veitch
et al (2010) and 0.06 m/s in GODAS around 15°E.
Meridional currents are near zero on the shelf, and
poleward undercurrents are weak in SODA (cf.
Figure 4c).
The CFS atmospheric climatology on a height section
at 32.5°S reveals a zonal overturning circulation
dominated by westerly winds above 1500 m with a
marked sinking component (Figure 5a) as expected
over an upwelling zone. There are weak rising
motions over the coast associated with orographic
uplift. Offshore winds in the marine layer are weak.
Meridional winds reflect a maximum >5 m/s near the
surface at 16°E (Figure 5b). This equatorward wind jet
slopes downward to the coast at 5 10
-4
(cf. Nicholson,
2010). Poleward wind flow <-3 m/s is located above
2000 m east of 18°E consistent with baroclinic effects
(thermal wind). Meridional wind variance >3 m/s is
seen in the 200-800 m layer from 15.5-17.5°E (Figure
5d) coincident with the equatorward wind jet (Jury
1985, 1987). Relative humidity (Figure 5c)
characterizes a marine layer (RH>60%) that is 1100 m
deep at 14°E sloping to 600 m at 18°E. Dry air
(RH<30%) associated with subsidence from the
subtropical anticyclone dips to 2000 m at 17-18°E.
The mean annual cycle is analyzed as time-longitude
hovmoller plots on 32.5°S using SODA reanalysis.
The wind stress reveals an equatorward jet on 18°E
produced by the upstream cape. Equatorward wind