Basic HTML Version


International Journal of Marine Science 2013, Vol.3, No.34, 267-277
http://ijms.sophiapublisher.com
271
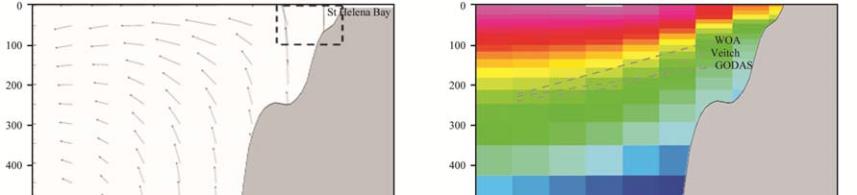
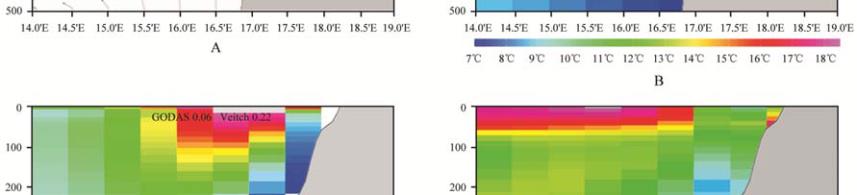
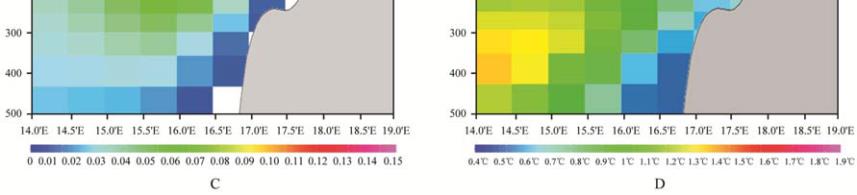
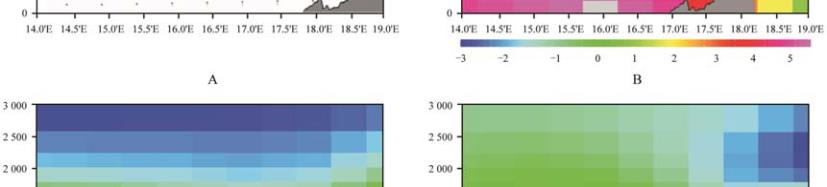
Figure 4 SODA oceanic depth section on 32.5°S of mean annual: a) zonal overturning circulation (m/s) with W exaggerated 10
3
, b)
sea temperature (
℃
), c) meridional current (m/s) and d) its standard deviation
Note: Z-axis in m with shelf profile. Dashed box in a) refers to index area. Dashed lines in b) display 12
℃
isotherm from WOA,
GODAS and Veitch et al (2010); values in c) are meridional current maximum. All averaged 1980-2008
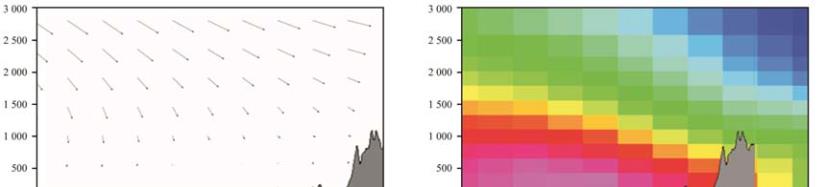
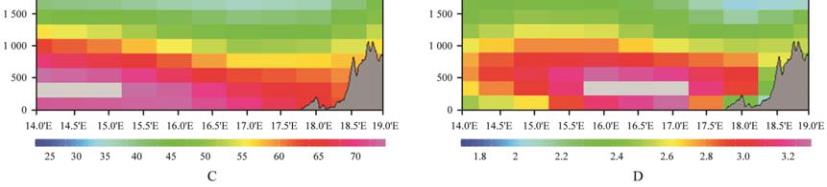
Figure 5 CFS atmospheric height section on 32.5°S of mean annual: a) zonal overturning circulation (m/s) with W exaggerated 10
2
, b)
meridional wind (m/s) and its d) standard deviation; c) relative humidity (%)
Note: Z-axis in m with terrain profile. All analyzed 1980-2008