International Journal of Aquaculture, 2018, Vol.8, No.11, 77-89
83
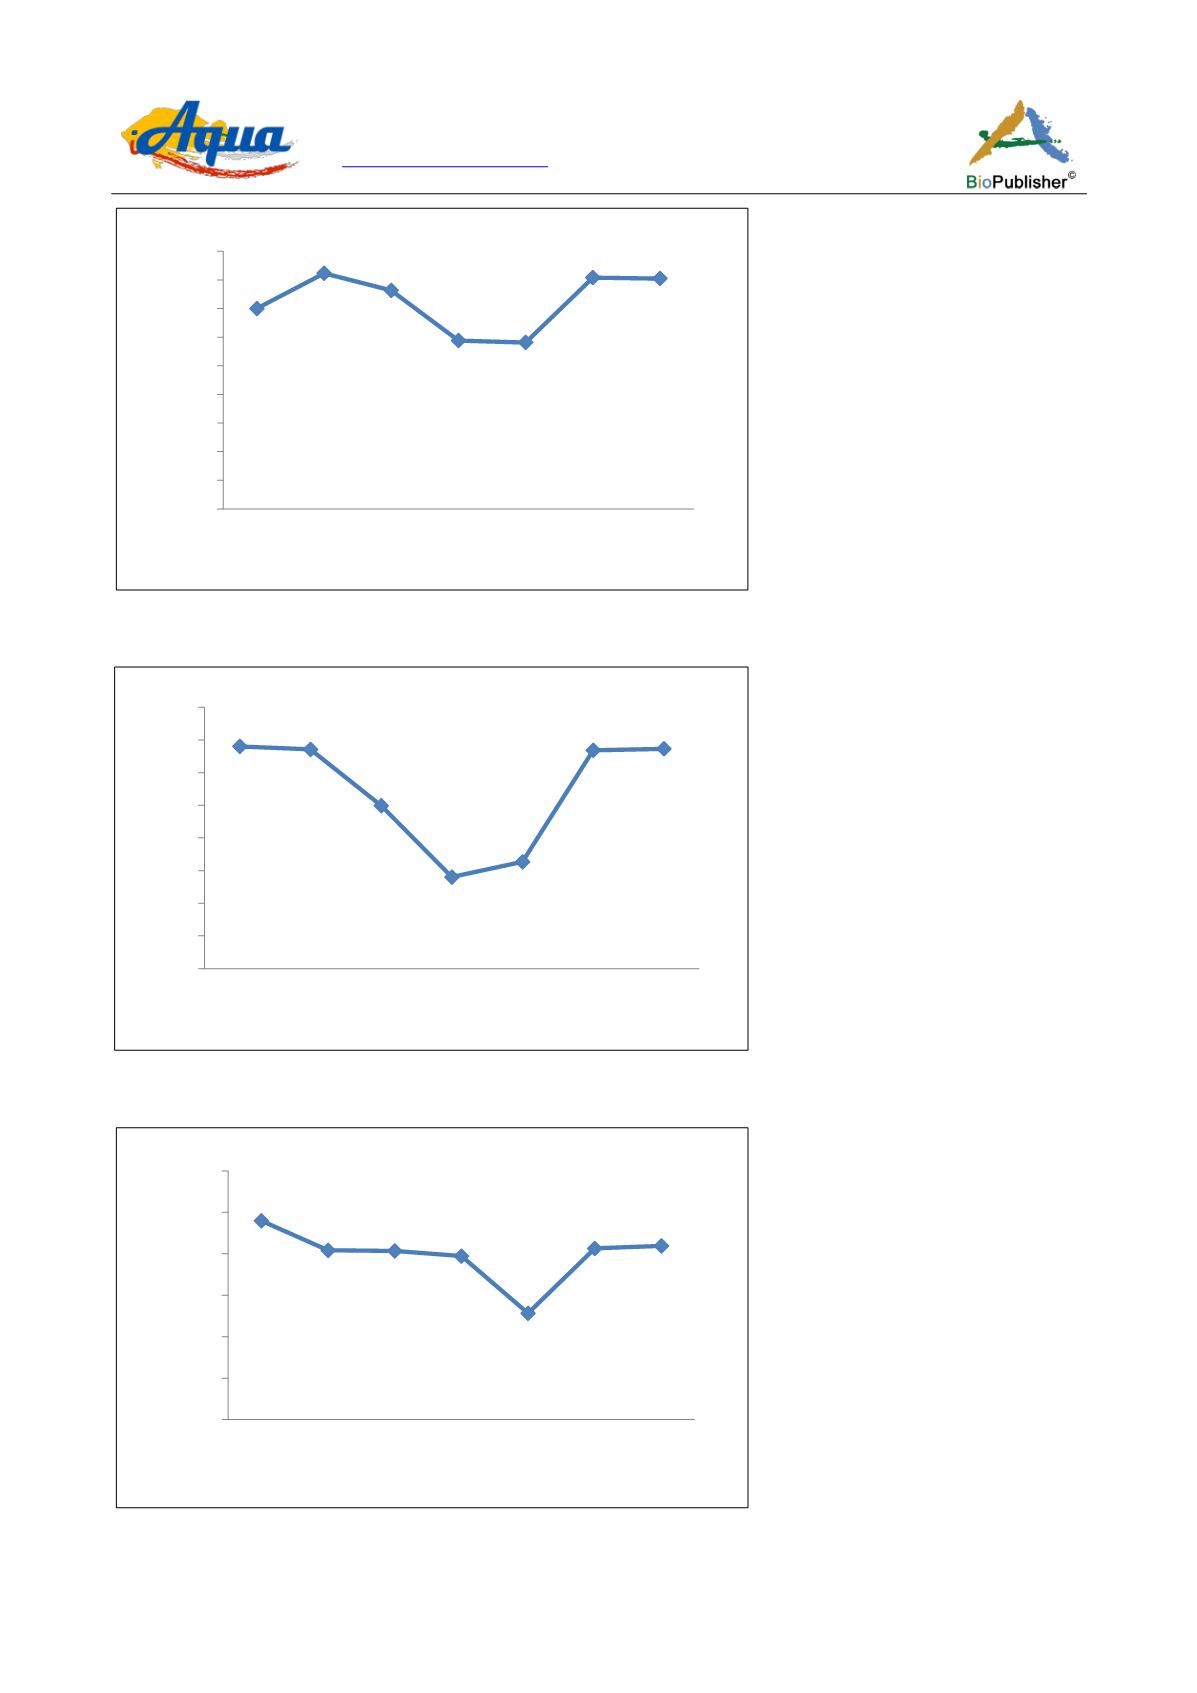
Figure 9 Mean cell volume (fl) in blood of
Clarias gariepinus
sub-adult exposed to 2, 4-Dimethyl Amine
Note: There were significant differences between the mean values (α = 0.05)
Figure 10 Mean cell haemoglobin (pg) in blood of
Clarias gariepinus
sub-adult exposed to 2, 4-Dimethyl Amine
Note: There were significant differences between the means (α = 0.05)
Figure 11 Mean cell haemoglobin concentration (g/dl) in blood of
Clarias gariepinus
sub-adult exposed to 2, 4-Dimethyl Amine
Note: There were significant differences between the means (α = 0.05)
0
20
40
60
80
100
120
140
160
180
0
5
10
15
20
25
30
Mean cell volume (ft)
Conc. of 2, 4-Dimethyl Amine (mg/L)
ab
a
a
b
b
a
a
0
10
20
30
40
50
60
70
80
0
5
10
15
20
25
30
Mean cell haemoglobin (pg)
Conc. of 2, 4-Dimethyl Amine (mg/L)
a
a
a
b
b
a
a
0
10
20
30
40
50
60
0
5
10
15
20
25
30
Mean cell haemoglobin conc.
(g/dl)
Conc. of 2, 4-Dimethyl Amine (mg/L)
a
a
a
a
b
a
a


