International Journal of Aquaculture, 2016, Vol.6, No.2, 1
-
9
4
14-2012-03865 by the Ethics and Biosafety Committee of the School of Veterinary Sciences of the Northeast
National University (UNNE) of Argentine.
2.7 Statistical evaluation
All the assays were performed by triplicate using a completely randomized design. Each replicate corresponds to
different parents, excluding the genetic factor of the experiment. Statistical analyses were carried out using
Statistica 6.0 for Microsoft Windows. Comparisons were performed, first, by a one way ANOVA including the
ten experimental groups followed by a control vs. treatments comparison. Later, results were compared, excluding
the control, by using a factorial two-way ANOVA with subsequent post hoc test in order to evaluate the main
effects of doses and stages as well as the interactions between them. When interaction and significant effects were
not detected, results were evaluated by orthogonal polynomials for trend analysis.
3 Results
The one way ANOVA of survival, mean weight and produced biomass of larvae administered with the microbial
mixture of LAB does not indicate significant differences between treatments and control group (p>0.05) (Table 2).
On the other hand, the two ways ANOVA analysis does not show neither interaction between doses and stages nor
significant effect of dose or stage over any of the variables analyzed (p>0.05) (Figure 1). However, the low
parameters in some of the treatments with dose 7 and 10 allowed to select the LAB suspension (composed by
E.
faecium
strains CRL1940 and CRL1941 and
P. acidilactici
CRL 1939), containing 6x10
4
CFU L-1 of each strain
as the most suitable for its incorporation to a composite probiotic formula to be tested in future assays (Figure 2).
Table 2 One way ANOVA of mean weight, survival and biomass of
P. mesopotamicus
larvae administered with LAB mixture in
different doses and stages
Variable
N
SS
df
MS
F
p-value
Mean weight (mg)
30
5.99
9
0.62
2.40
0.0494
Survival (%)
30
5336.48
9
592.94
1.47
0.2241
Biomass (mg)
30
275674.00
9
30630.44
1.88
0.1151
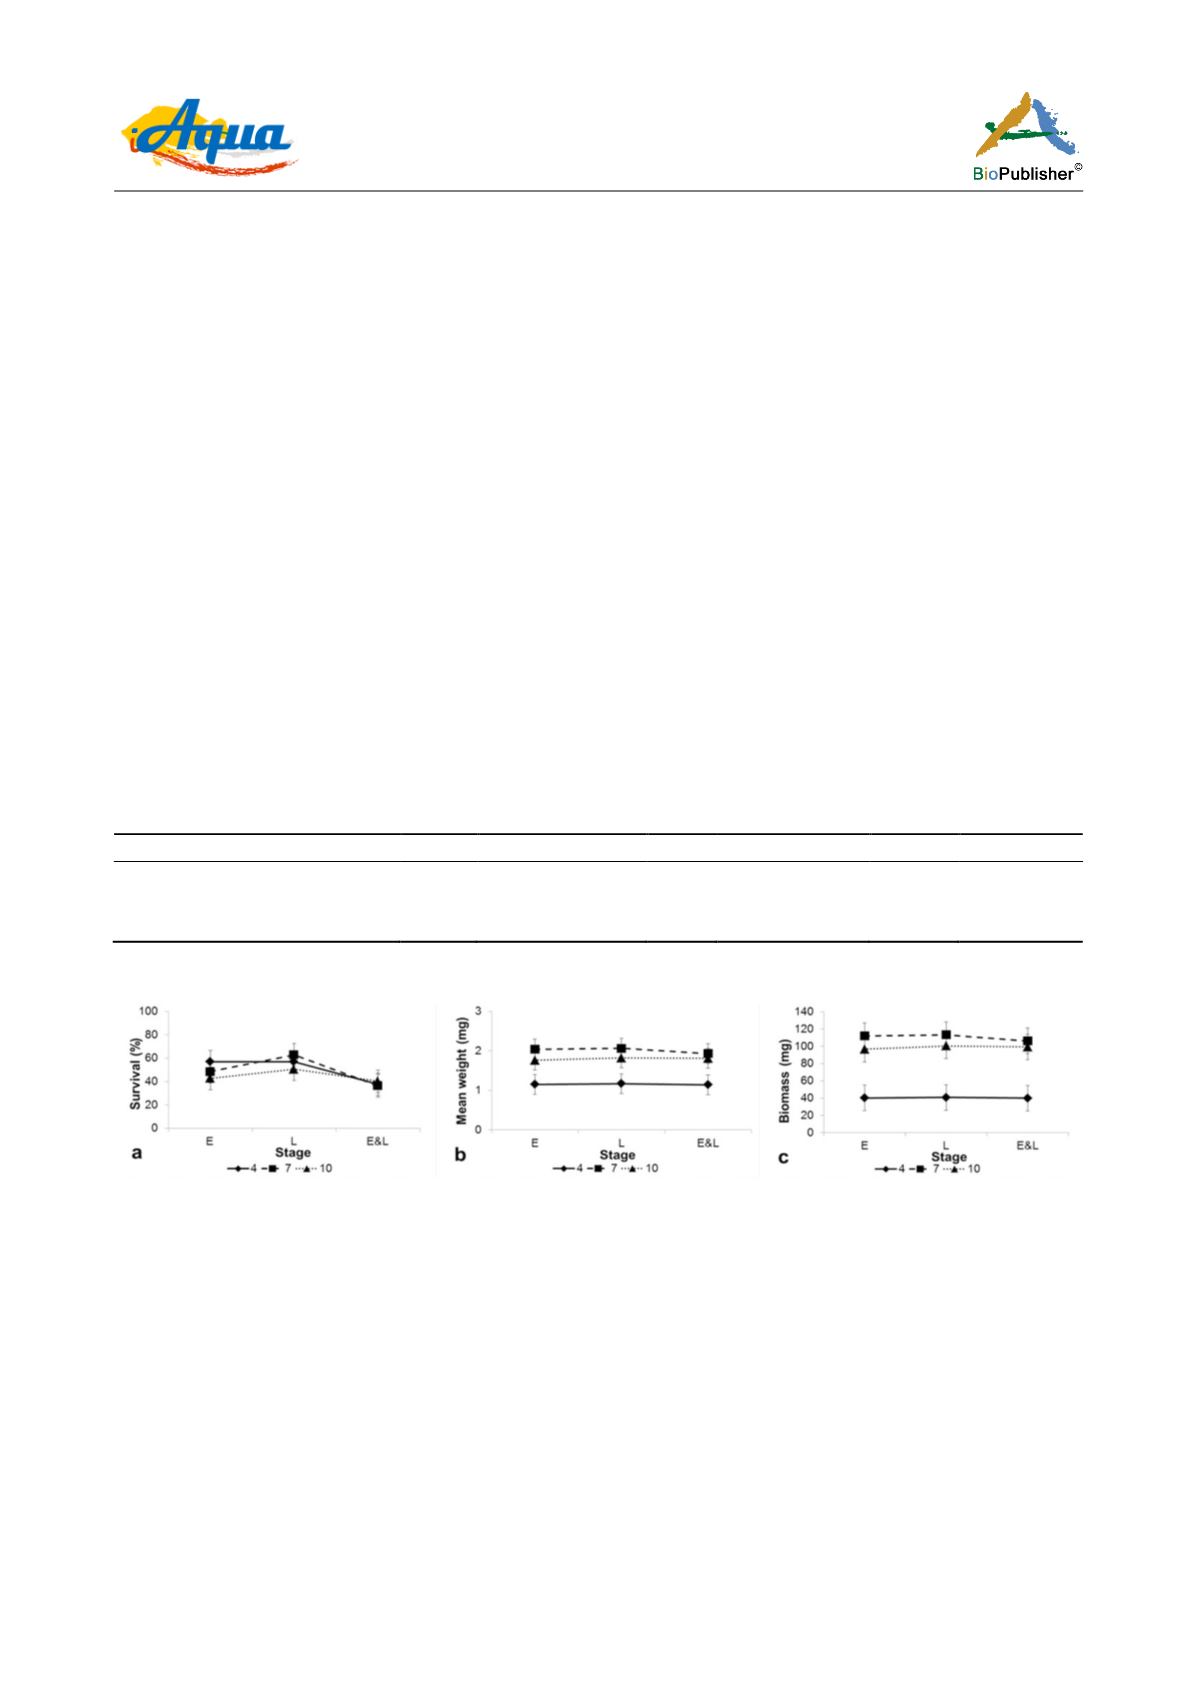
Figure 1 Two-ways assay results showing the stage-dose interaction on survival
Note: (a) mean weight (b) and biomass (c) of LAB suspension on
Piaractus mesopotamicus
parameters. Vertical bars indicate SE
The one-way ANOVA of the administration of ENT suspension (Table 3) shows no significant differences in the
survival percentage of the specimens (p>0.05), with similar values after all the treatments (Figure 3). The
two-ways ANOVA analysis shows neither dose-phase interaction nor significant effect of the stage of
administration (p>0.05) (Figure 4). However, the orthogonal polynomials for trend analysis of the dose effect
detected a significant effect of the linear and quadratic contrasts of the mean weight and biomass (p>0.05) (Table
4). The quadratic contrast showed to be the best model to describe the polynomial function for both variables due
to the fact that the highest estimated values belonged to dose 6x10
7
CFU L-1.


