Genomics and Applied Biology 2018, Vol.9, No.3, 14-19
17
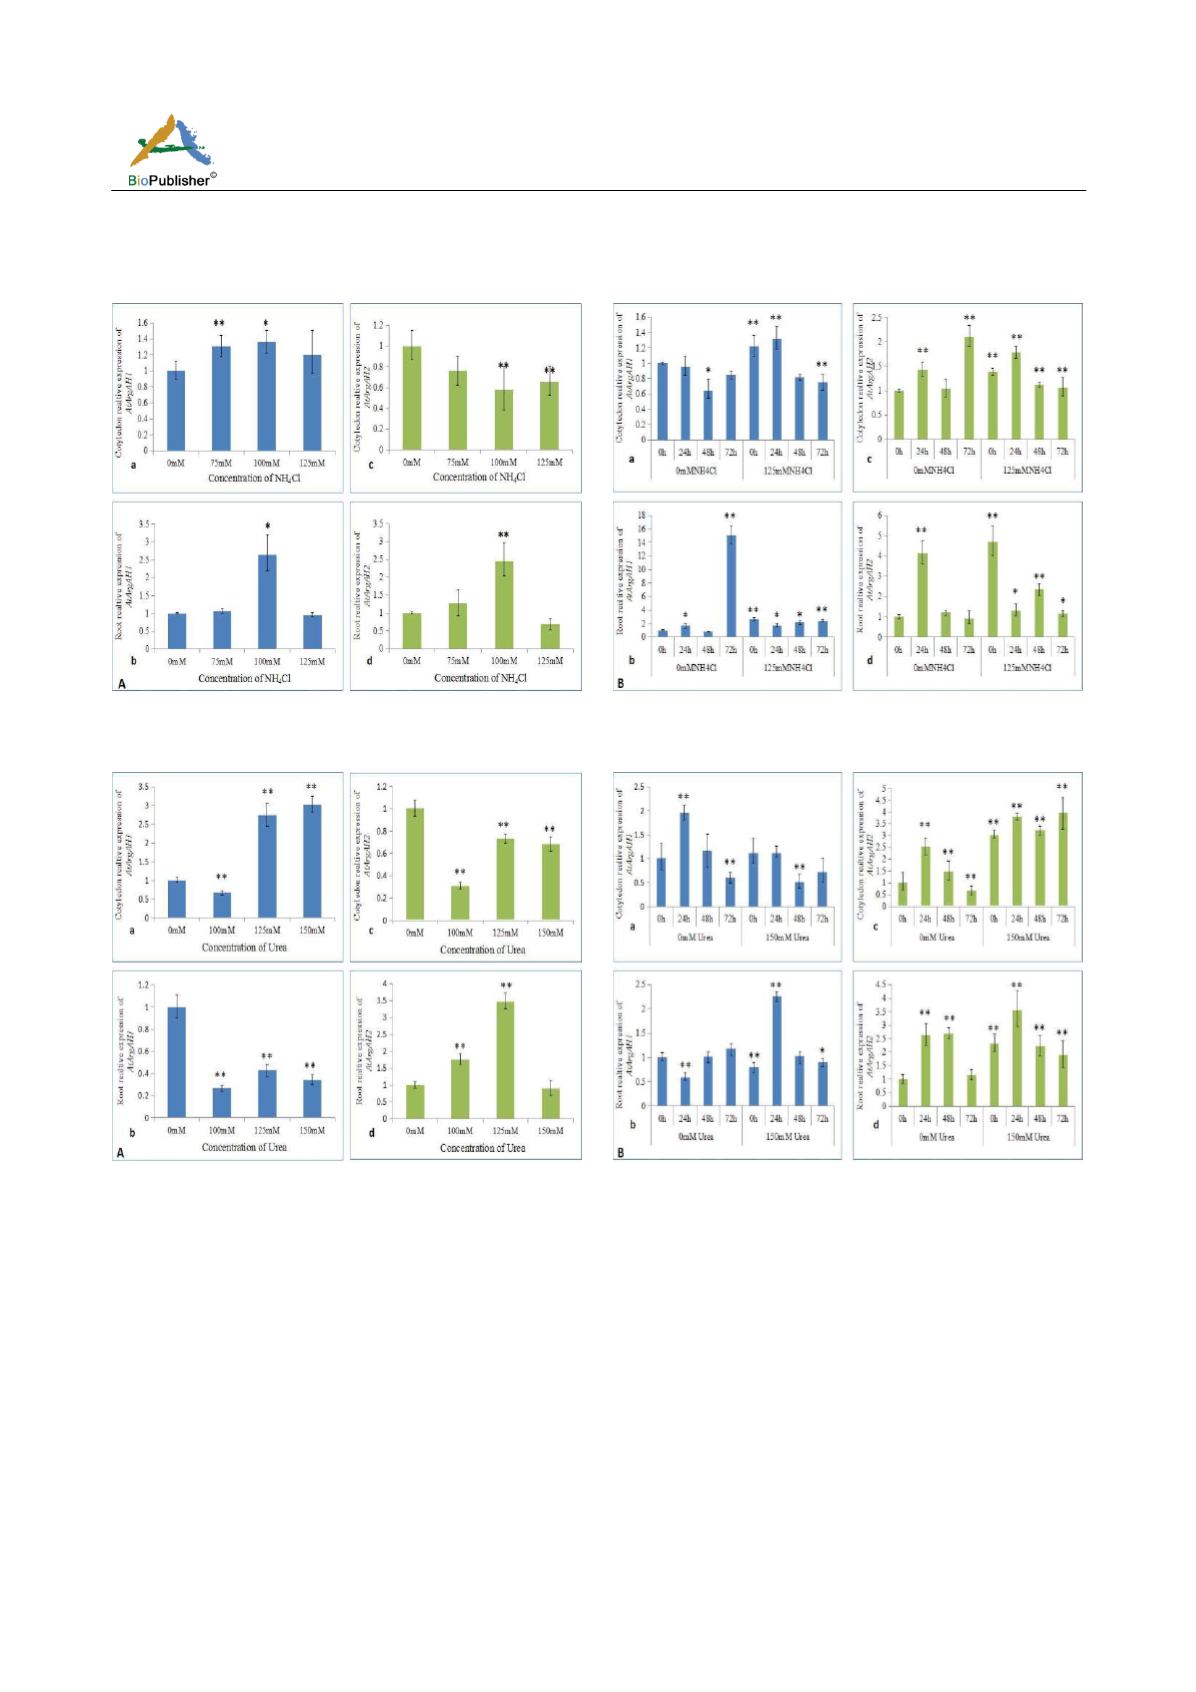
dramatic upward trend, and the expression decreased at 72 h (Figure 4-B-d). In the treatment group,
AtArgAH1
was down-regulated in cotyledons, up-regulated in young roots, and the highest point was at 24 h. The expression
of
AtArgAH2
increased significantly in both cotyledons and young roots.
Figure 3 Expression analysis of arginase gene in different tissues under different concentration (A) and different times (B) of NH
4
Cl
stress
Figure 4 Expression analysis of arginase gene in different tissues under different concentration (A) and different times (B) of Urea
stress
2.5 Expression analysis of
AtArgAH1
and
AtArgAH2
in response to arginine treatment
Under the arginine treatment, the expression of two genes in cotyledons showed a similar trend in which they
were considerably up-regulated (Figure 5-A-a, c). In root, on contrast, there was only one significant increase at
1.25 mM in both genes, and the rest of concentrations had no noticeable change (Figure 5-A-b, d). However, the
expression level of
AtArgAH1
gene relative to control (0 mM) in cotyledons was higher than in
AtArgAH2.
In Figure 5-B, in the control group,
AtArgAH1
was up-regulated in both cotyledons (Figure 5-B-a) and young
roots (Figure 5-B-b), while
AtArgAH2
showed a significant downward tendency as time went by in cotyledons
(Figure 5-B-c). On the other hand,
AtArgAH2
was dramatically up-regulated in young roots (Figure 5-B-d), except
for a slight decrease at 24 h. In the treatment group, both genes were all up-regulated in most times. However,
there were some decreases in both genes in cotyledons at 72 h and the
AtArgAH1
in roots at 0 h.


