Genomics and Applied Biology 2018, Vol.9, No.3, 14-19
15
In this study, we analysed the expression pattern of
ArgAHA1
and
ArgAHA2
genes in response to salt stress and
different nitrogen nutrient during seed germination in
Arabidopsis thaliana
. Our results show that
ArgAH2
was
highly expressed in siliques,
ArgAH1
was highly expressed in root under normal conditions, respectively. Under
salt stress condition, the expression levels of
ArgAH1
and
ArgAH2
was up-regulated in both roots and cotyledons.
In addition,
under
different nitrogen sources, the expression levels of
ArgAH1
and
ArgAH2
were shown different
pattern in both the roots and cotyledons.
1 Materials and Methods
1.1 Plant materials and growth conditions
Arabidopsis thaliana
(wild-type, Col-0) was used in this study. Seeds were sown on half Murashige and Skoog
(1/2MS) medium containing 0.8% sucrose (w/v) with or without different stresses. After 4°C for 2 days in darkness
treatment, the seedlings were grown at 22°C growth chamber under a 12 h-light/12 h-dark cycle.
1.2 Gene expression analysis
Different organs (roots, stems, leaves, panicle and siliques) of 3 weeks plants were sampled for qRT-PCR. A
second batch of seedlings were treated with different concentrations of various stresses (NaCl, NH
4
Cl, Urea,
Arginine). The roots and cotyledons were sampled after 0, 24, 48, or 72 h treatment. Total RNA was isolated using
Trizol (Thermo, USA), cDNA was synthesized using reverse transcriptase (TAKARA). Using
Arabidopsis ACTIN
gene as an internal standard (Table 1), relative quantification were performed with SYBR green using the
real-time qPCR (Agilent, MX3000p).
Table 1 sequence of the primers used for quantitative real-time PCR
Primer
Sequence(5’-3’)
Actin-FW
5’-GGTAACATTGTGCTCAGTGGTGG-3’
Actin-RV
5’-AACGACCTTAATCTTCATGCTGC-3’
AtArgAH1-FW
5’-TTGCGTCCGTTGGTCTTA-3’
AtArgAH1-RV
5’-TTGTTCCCGTCCTTCCTG-3’
AtArgAH2-FW
5’-GACCCGTGGATATTCTTCAT-3’
AtArgAH2-RV
5’-TTCGCATCTCATACTGTTCTACTC-3’
2 Results and Discussion
2.1 Tissue specific analysis of
AtArgAH1
and
AtArgAH2
in Arabidopsis
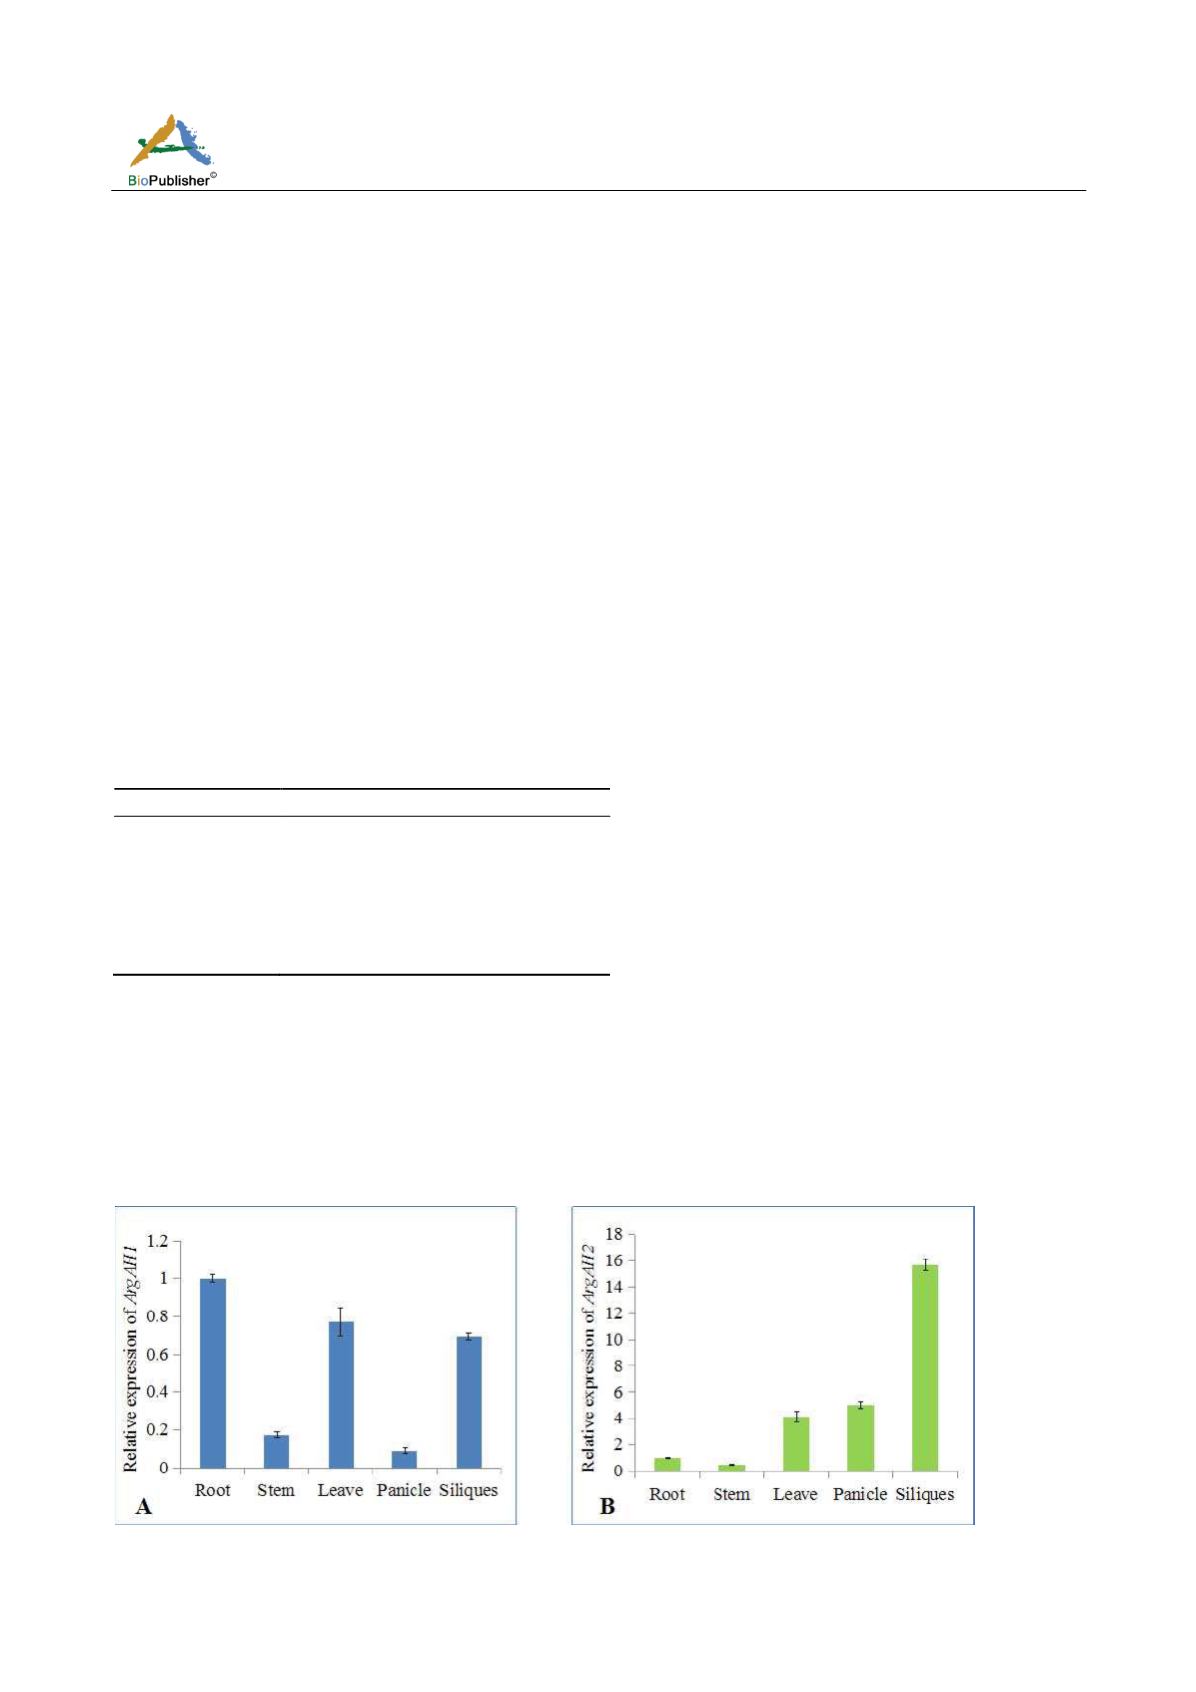
According to Figure 1-A,
AtArgAH1
was mainly expressed in root, leaf, siliques while stem and panicle include
small amount of
AtArgAH1
. The expression of
AtArgAH2
was highest in siliques, while it was very low in root and
stem (Figure 1-B). It can be concluded that the expression of
AtArgAH2
is dominant and high at the mature stage,
indicating some differences between the two genes. The pollen contained only
ArgAH1
in a tissue-specific manner
(Brownfield et al., 2008). In contrast, only
ArgAH2
expression was induced after MeJA treatment.
Figure 1 Specific analysis of
ArgAH1
(A) and
ArgAH2
(B) genes expression in tissue by quantitative real-time PCR


