Genomics and Applied Biology 2018, Vol.9, No.3, 14-19
16
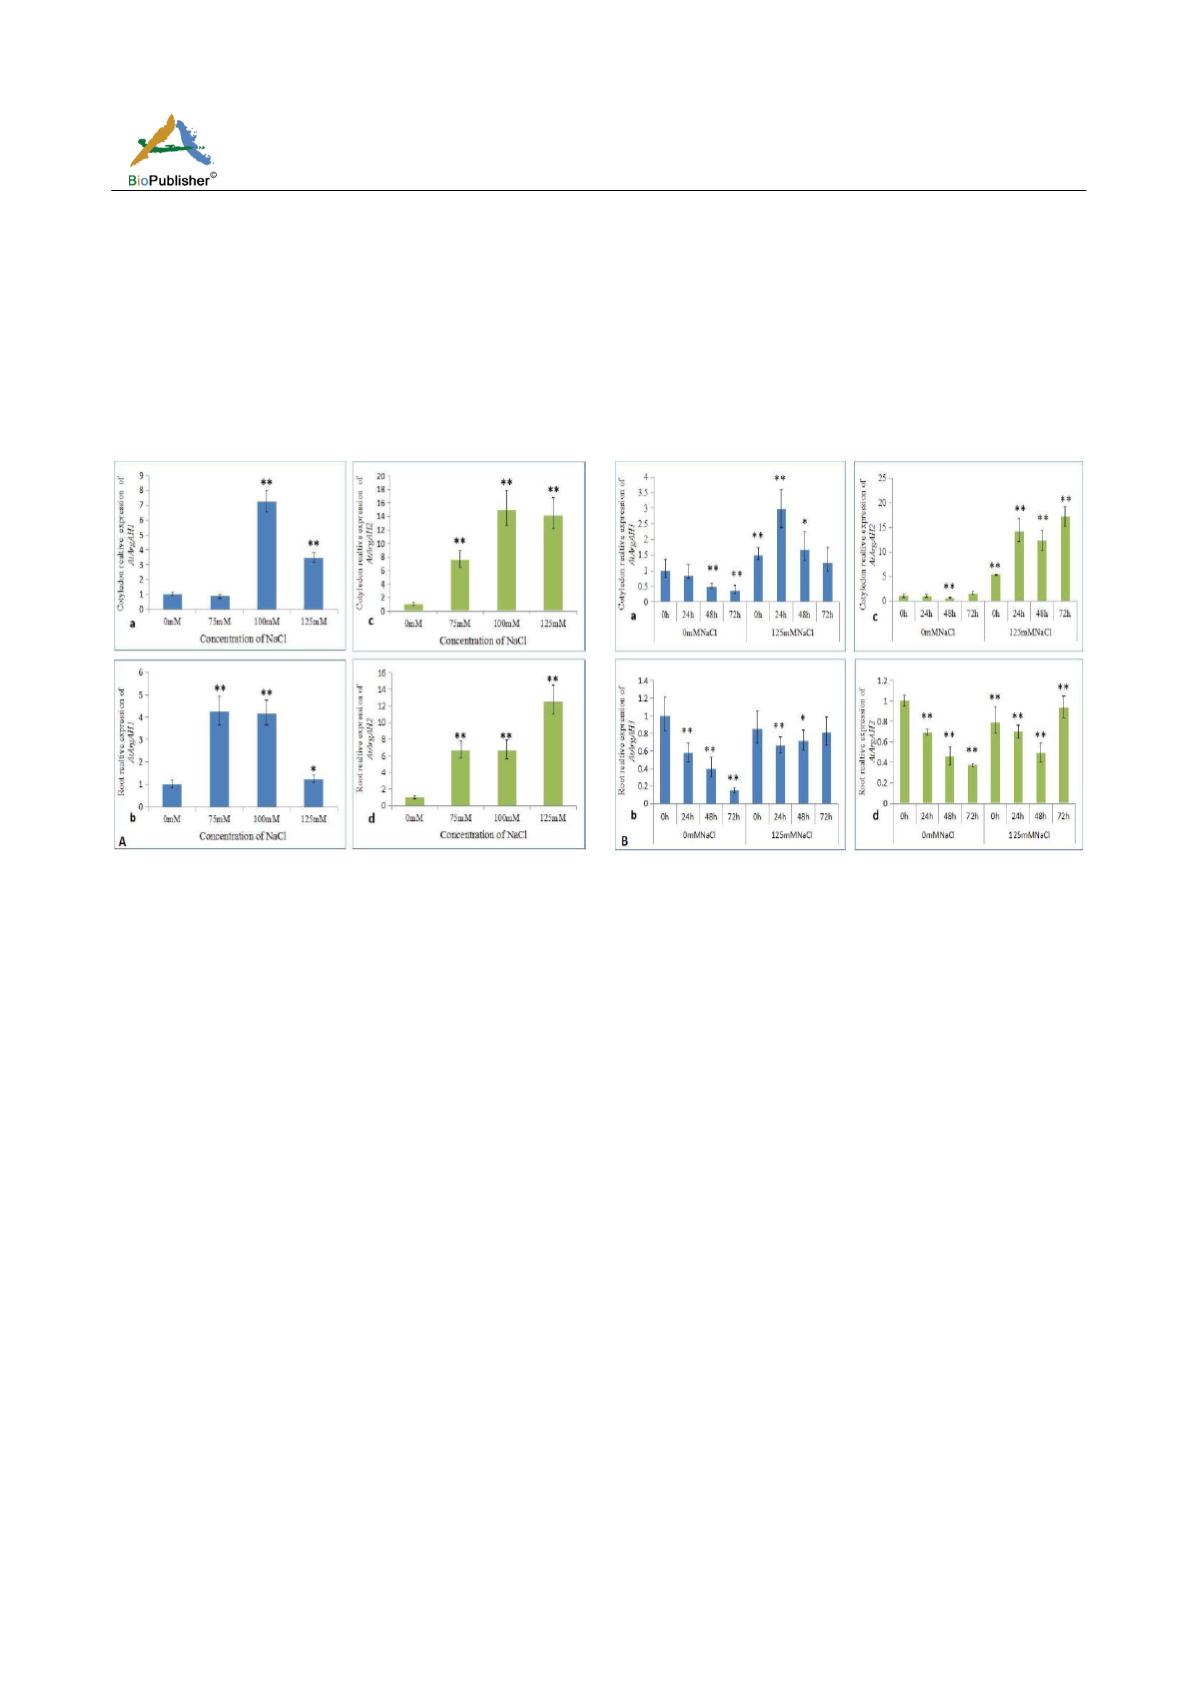
2.2 Expression analysis of
AtArgAH1
and
AtArgAH2
in response to NaCl stress
Under the different concentrations of NaCl treatment, both genes were significantly up-regulated, except for
AtArgAH1
in cotyledons under 75 mmol/L (Figure 2-A-a). But, the increasing level in
AtArgAH2
was higher than
AtArgAH1
, and the expression level of two genes in cotyledons higher than in young roots in the same way.
In Figure 2-B, two genes in the control group (0 mM NaCl) were gradually down-regulated. In the treatment
group (125 mM NaCl), the expression of two genes showed a similar trend, that is, up-regulated in cotyledons
(Figure 2-B-a, c) and down-regulated in young roots (Figure 2-B-b, c). In addition, the expression of
AtArgAH2
in
cotyledons increased more significantly than
AtArgAH1
.
Figure 2 Expression analysis of arginase gene in different tissues under different concentration (A) and different times (B) of NaCl
stress
2.3 Expression analysis of
AtArgAH1
and
AtArgAH2
in response to NH
4
Cl treatment
Under the different concentrations of NH
4
Cl stress,
AtArgAH1
was up-regulated in cotyledons (Figure 3-A-a),
while
AtArgAH2
in cotyledons showed a downward trend, particularly, at 100, 125 mmol/L (Figure 3-A-c). The
AtArgAH1
in the young roots showed no obvious change, except for a significant increase at 100 mM (Figure
3-A-b). In contrast,
AtArgAH2
followed a increasing trend at first reaching a highest point at 100 mM, and then
followed a dramatic decrease (Figure 3-A-d).
In Figure 3-B, in the control group, the expression of
AtArgAH1
in cotyledons was slightly down-regulated in
most times, but the considerable reduction was only recorded at 48 h (Figure 3-B-a). The rest of control group
showed substantial increases. In the treatment group, both genes were significantly up-regulated in most cases,
except for
AtArgAH1
at 72 h in cotyledons (Figure 3-B-a). Overall, there was no significant difference between
two genes under the treatment.
2.4 Expression analysis of
AtArgAH1
and
AtArgAH2
in response to Urea treatment
Under the urea treatment, the expression of
AtArgAH1
was moderately down-regulated in cotyledons at 100
mmol/L, and then increased dramatically at higher concentrations (Figure 4-A-a). On contrast,
AtArgAH1
in
young roots showed a significant downward tendency
(Figure 4-1-B), which was the same with
AtArgAH2
in
cotyledons (Figure 4-A-c).
AtArgAH2
in young roots was gradually up-regulated (Figure 4-A-d) although the
expression decreased dramatically at highest concentration (150 mmol/L), but it was almost indistinguishable
from the control (0 mmol/L).
In Figure 4-B, in the control group, both genes were up-regulated in cotyledons, but significantly down-regulated
at 72 h (Figure 4-B-a, c). The expression of
AtArgAH1
was substantially down-regulated in young roots at first,
but it was slightly up-regulated again as time passed (Figure 4-B-b). The
AtArgAH2
gene in roots showed a


