基本HTML版本


Bioscience Methods 2014, Vol.6, No.1, 1-13
http://bm.biopublisher.ca
6
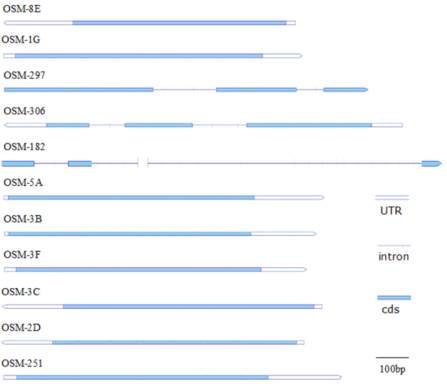
Figure 7 Diagram of the structure of the eleven
StOSM
transcripts.
The diagram is drawn to scale, according to the alignment of the
cDNA sequences with the corresponding genomic sequences. All
genomic sequences for
StOSM
were obtained from sequencing
data from the Potato Genome Sequencing Consortium website
exon of these two genes have 5 nt and 7 nt in common,
respectively. These findings imply that the two exonic
splicing patterns are conserved between the two genes.
The lengths of the UTRs (untranslated region), which
are important in the regulation of RNA mobility
(Banerjee et al. 2006 and 2009), were compared using
sequences from either the clones obtained in this study
or web-based RNA data. The
StOSM
-306 5’UTR is
120 nt, and the
StOSM
-251 3’UTR is 220 nt. Both
were the longest UTRs among the eleven
StOSM
s
(Table 1).
StOSM
-182 and
StOSM
-297, which contain
two introns, have neither a 5’UTR nor a 3’UTR.
1.2 Expression of
StOSM
family under water stress
1.2.1
StOSM
expression analysis by mined RNA-Seq
data
Among the RNA-Seq data of
S. tuberosum
genotype
RH89-039-16 from the published potato genome (Xu
et al. 2011 and Cory et al. 2014), the only available
RNA-Seq data under water stress is from the RH leaf.
Therefore, the RNA-Seq data for certain RH organs,
including leaf with and without water stress, stem,
roots, stolon and mature tuber, were selected and
compared with respect to the expression of the eleven
StOSM
genes. The fragments per kb per million
mapped reads (FPKM) in leaves were compared with
the FPKM in the other four organs (Figure 8).
Figure 8 Expression profile for the FPKM value of eleven potato
OSM
s in selected organs. The data were mined using the RNA-seq
data for the genotype RH89-039-16 haplotype from the publically available Potato Genome Database [12]. Abundance is represented
in FPKM (fragments per kb per million mapped reads) values. “Leaf ws” stands for leaf under water stress