基本HTML版本


Bioscience Methods 2014, Vol.6, No.1, 1-13
http://bm.biopublisher.ca
7
StOSM
-297 mRNA occurred at a low FPKM level in
the control leaf and at high FPKM levels in the other
four organs. The absence of a detectable FPKM level
in leaves under water stress suggests that
StOSM
-297
is only one of eleven
StOSMs
and that its expression
in leaves was supressed by the induction of water
stress (Figure 8). Although
StOSM
-251 is present in
both the treatment and control leaves,
StOSM
-182 was
expressed at a very low level in the tuber and control
leaf (Figure 8), and the eleven
StOSM
transcripts were
ubiquitously observed in a variety of organs.
The most striking feature of this
StOSM
mRNA
expression profile, however, was that eight of the
eleven
StOSM
genes in RH leaves under water stress
exhibited 24-54-fold higher FPKM values than in the
control leaves and the other four organs (Figure 8).
Overall, the average FPKM value of three
StOSMs
,
StOSM-
3F,
-
1G and
-
8E, in leaves under stress were
33-fold higher than in the control, exhibiting the
highest FPKM values (Figure 8). In contrast, the
FPKM values for
StOSM-306
and
-251
in leaves
under water stress was approximately 3-fold lower
than in the control.
The average FPKM value of the other 5
StOSMs
that
increased
in response to water stress was 21-fold
higher than in the control (Figure 8).
StOSM-8E
was
the most abundant RNA of the eleven
StOSMs
, and
the top three ranked
StOSM
s by expression are
StOSM-
3F,
-
1G and
-
8E (Figure 8).
Both the 21-33-fold increase and the 3-fold decrease
of the FPKM values for the eleven
StOSM
s induced
by drought suggest that the
StOSM
s not only are
associated with low temperature, abscisic acid and
NaCl, but also respond positively to water stress as
drought-induced genes.
1.2.2
StOSM
Expression Analysis by Reverse
transcription PCR
When WCM decreased to 10%±2%, the leaves of the
seedling became crimpy and then died. Therefore,
WCM at 20%±2% was defined as the potato
drought-lethal critical point (DLP) in this case. Using
StOSM
member-specific primers and total RNA from
leaf samples grown under the 7 degressive WCM
gradient groups, reverse transcription PCR (RT-PCR)
was performed in triplicate.
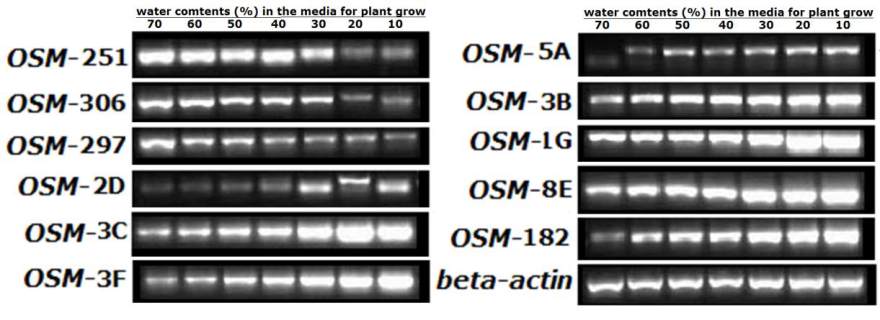
RT-PCR analysis showed that eight of the eleven
StOSMs
,
StOSM
-8E, -1G, 3B, -3F, 5A, 3C, 2D and
-182, were upregulated in response to the degressive
gradient of water availability (Figure 9). The peak
mRNA accumulation of all upregulated
StOSMs
was
reached at the DLP. Among the eight upregulated
StOSM
s,
StOSM-
1G and -8E synchronously showed
much stronger and higher increases than the others.
The expression attenuation of three
StOSMs,
StOSM
-297, -251 and -306, was observed for the same
case (Figure 9).
StOSM-
1G and -8E synchronously
showed much stronger and higher increases in mRNA
accumulation than the other
upregulated
StOSMs
over
the degressive gradient.
Figure 9 Dynamic quantification of leaf
OSM
mRNA accumulation over the decreasinggressive gradient. Under the degressive
gradient of water stress from 70% ±5% to 10% ±2% (DLP),
OSM
mRNA accumulation was assayed by reverse transcription PCR in
the leaves of the potato species,
S. tuberosum
ssp. ZHB (WCM: water content of the media in which the plants grow)