Basic HTML Version


Triticeae Genomics and Genetics 2012, Vol.3, No.2, 9
-
24
http://tgg.sophiapublisher.com
12
et al., 2002) also reported QTLs for grain colour (GC),
closely associated with QTLs for PHST. Following
criteria were used for construction of consensus
map using framework maps from 15 studies: (1) A
chromosome in a framework map having no more
than one common marker in the corresponding
chromosome of the pre-consensus map was excluded.
(2) Inversion of marker order was filtered out by
discarding inconsistent loci with the exception of very
closely linked markers. If two or more markers in a
map are available in inverted orientation relative to
pre-consensus map, then one of the two closest
markers available in inverted order and separated by a
distance of less than 1 cM, was dropped to retain a
maximum number of common markers. (3) When all
the common markers were in reverse order with
respect to the pre-consensus map, we used inverted
genetic map for projection. In all other situations,
QTLs were not projected.
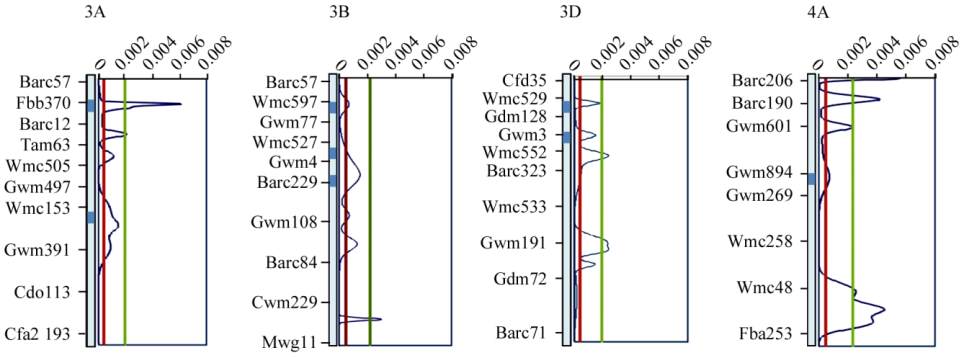
1.4 Overview of QTLs for PHST and related traits
The overview statistics of QTL repartitioning along
the four chromosomes were also obtained (Figure 2).
Density curves had 24 peaks that exceeded the
average value
U
(
x
), suggesting that several hot-spots
are present on these four chromosomes which may be
involved in PHST. On chromosome 3D and 4A some
of the adjoining peaks were very close to each other.
At nine regions, the curve shows sharp peaks
particularly with high values of
P
(
x
) [exceeding the
H
(
x
) value; 5 times of the average value]. These nine
sharp and high peaks include one on chromosome
3B, two each on 3A and 3D and four on 4A. The
results thus confirmed the MQTLs detected through
meta-QTL analysis. A representative example of the
results of overview of QTL repartitioning involving
chromosome 3A, is presented in Figure 3, where two
MQTLs (MQTL 1 and 2) positioned at 18.46 cM and
96.48 cM (Figure 3) were confirmed by two separate
peaks at the corresponding positions. These peaks
exceed the average
U
(
x
) value, thus confirming the
two MQTLs detected through meta-analysis.
1.5 Meta-QTL analysis
Genomic regions identified through overview were
than analyzed for the presence of true QTLs for
PHST/dormancy using another approach, meta-QTL
analysis. Using this approach, out of 24 regions with
peaks, in 8 genomic regions meta-QTLs were identified,
either at same or nearby location (Figure 2). In this
process 50 QTLs that were found suitable for meta-QTL
analysis were projected on the consensus map for four
chromosomes selected for the present study. A total of
8 MQTLs (designated as MQTL1 to MQTL8) were
identified using only 36 of the 50 QTLs that were
projected (Table 2), thus leaving out 14 QTLs, which
could not be condensed further using meta-QTL
analysis. These 36 QTLs were integrated into 8 MQTLs,
Figure 2 Representation of overview and meta-analysis results for PHST and dormancy
Note: Two horizontal lines green and red representing the two values
H
(
x
) and
U
(
x
) respectively; Dark shaded regions on
chromosomes representing the MQTLs identified on the particular chromosomes
Triticeae Genomics and Genetics Provisional Publishing