Basic HTML Version


Triticeae Genomics and Genetics 2012, Vol.3, No.2, 9
-
24
http://tgg.sophiapublisher.com
11
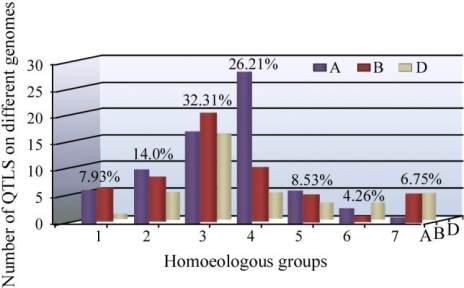
Figure 1 Distribution of QTLs for PHST, dormancy and grain
colour on seven homoeologous groups and the A, B and D
genomes of wheat
Note: Percentage given at the top of each homoeologous group
represents total number of QTLs on the each individual
homoeologous group
genome, 34% on B genome and 23% on D genome.
1.2 Selection of QTLs for meta-QTL analysis
As many as 30 studies reporting as many as ~165 QTLs
for PHST spread over all the 21 wheat chromosomes
were available, but only 24 of these studies reporting
64 QTLs spread over only four chromosomes (3A, 3B,
3D and 4A) were found suitable to be included in the
present study on meta-QTL analysis. The remaining
17 chromosomes did not have adequate number of
reported QTLs for meta-QTL analysis. The 64 QTLs
distributed on these four chromosomes belonged to
two groups, including those detected using level of
PHST as a trait, and those detected on the basis of
level of dormancy. Even within these two groups,
different parameters were used for the detection of
QTLs. For instance, PHST was measured using one of
the following two parameters: (1) sprouting index
(SI), which was based on counting sprouted seeds per
spike using either a specific formula as done in two
studies (McMaster and Derera, 1976; Townley-Smith
and Czarnecki, 2008) or using a 0-9 scale visually
as done in our own laboratory (Kulwal et al., 2004);
(2) visual sprouting seeds (VI), which was based on
the number of germinated seeds per 200 seeds.
Dormancy was estimated in most studies using
germination index (GI), using the formula used in
earlier studies (Walker-Simmons and Ried, 1988;
Reddy et al., 1985).
A summary of QTL studies that were used for
meta-QTL analysis in the present study is presented in
Table 1. Out of 64 QTLs that were initially selected
for meta-QTL analysis, the available information for
meta-QTL analysis for five QTLs was inadequate thus
reducing the number of QTLs to 59. Nine other QTLs,
each showing association with only one common
marker were also excluded, thus reducing further the
number to only 50 QTLs that were projected on
consensus maps (see next section). Each QTL is
characterized by its map position [most likely position
and confidence interval (C.I.) around this position],
LOD value and the proportion of phenotypic variance
explained (PVE, estimated through value of
R
2
).
Whenever the required information about position and
R
2
value for the QTLs was not available from a
particular study, the most likely position of QTLs was
determined as the middle point of the distance
between the two flanking markers, and the
R
2
value of
closest flanking marker was taken as the
R
2
value of
the QTL.
1.3 Development of a consensus map for QTL
projection
In bread wheat, a number of framework genetic maps
are available, one each for an individual mapping
population that was used for QTL interval mapping in
a particular study. However, the number of markers
common among different individual maps that were
used in the present study were not adequate for
construction of a consensus map and reliable
projection of QTL positions. Therefore, for developing
a consensus map, a pre-consensus map was first
created by integrating two available saturated genetic
maps including the most recent Somers’ consensus
SSR map (Somers et al., 2004) consisting of 1 235
markers and another composite map consisting of
4 506 markers, which was also produced in 2004
(http://wheat.pw.usda.gov).
The pre-consensus map developed as above was used
for developing a consensus map using 15 of the 24
studies involving QTL analysis for PHST/dormancy,
since only these carried sufficient information for
construction of consensus map and for meta-QTL
analysis. Out of these 15 studies, three individual
studies (Fofana et al., 2009; Imtiaz et al., 2008; Groos
Triticeae Genomics and Genetics Provisional Publishing