Basic HTML Version


Triticeae Genomics and Genetics 2012, Vol.3, No.2, 9
-
24
http://tgg.sophiapublisher.com
13
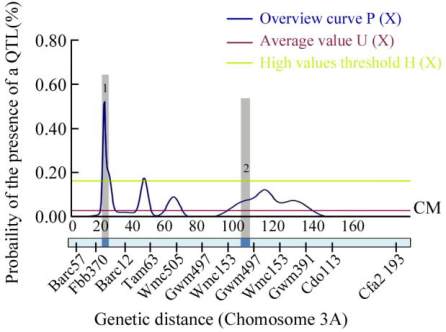
Figure 3 Results of overview analysis of wheat chromosome
3A
Note: The overview shows two “real” QTLs, one each at
~18.46 and ~96.4 cM, as identified in meta-QTL analysis
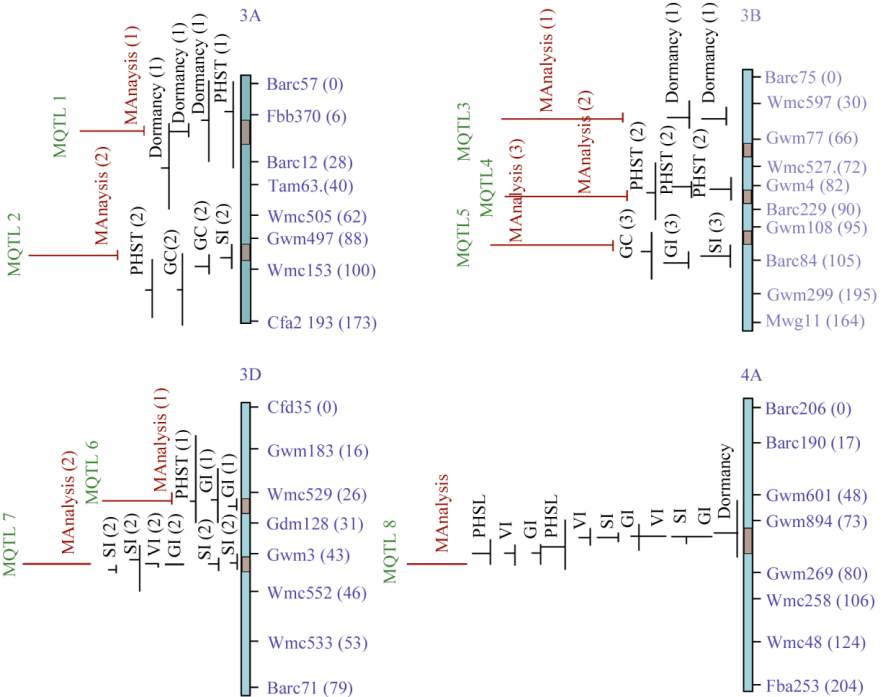
an individual MQTL resulting due to integration of 2
to 11 QTLs. Out of 8 MQTLs, 7 MQTLs were located
on chromosomes of homoeologous group 3 including
3A (2 MQTL), 3B (3 MQTL) and 3D (2 MQTL) and
1 MQTL was located on chromosome 4A. The
integrated QTL maps of four individual chromosomes
are presented in Figure 4. It may be noticed that while
some individual QTL clusters (condensed into MQTL)
had original QTLs either only for PHST or only for
dormancy, there were others, which included original
QTLs for PHST as well as dormancy, and still others
QTL clusters had original QTLs for all three traits
(PHST, dormancy and GC). For example, on chromo-
some 3B, 3 QTLs for PHST clustered at 85.27 cM
(MQTL 4) and 2 QTLs for dormancy clustered at
68.93 cM (MQTL 3). For MQTL 8 on chromosome 4
A at 75.75 cM, the 11 original QTLs that clustered
Figure 4 Demonstration of QTL meta-analysis results of four chromosomes: 3A, 3B, 3D and 4A
Note: Confidence intervals of eight identified MQTL are displayed as thick pink bars on the chromosomes
Triticeae Genomics and Genetics Provisional Publishing