Basic HTML Version


Plant Gene and Trait 2012, Vol.3, No.6, 28
-
33
http://pgt.sophiapublisher.com
30
Table 1 Yellowing index presented in parents and distributed in F
2
population
Trait
Yunyan85
Dabaijin599
Max
Min
Mean
SD
Kurtosis
Skewness
Easy curing
potential (%)
28.71
14.24
30.48
10.48
17.93
4.190
-
0.099 39
0.654 8
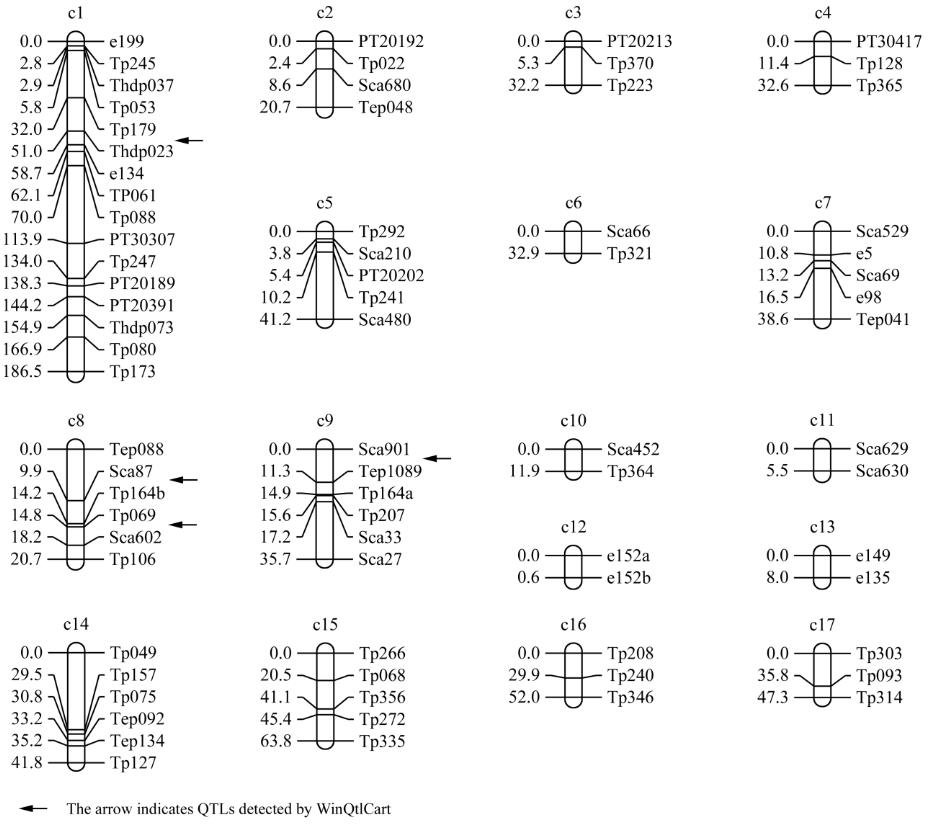
1.3 QTL analysis of the easy curing potential
QTL analysis of the easy curing potential in the
flue-cured tobacco was conducted using composite
interval mapping methods based on the genetic map;
four QTLs related to the traits of the yellowing index
were detected, which were located in the linkage
group of the c1, c8 and c9 (Table 2; Figure 2), thereinto,
qECP
-
1
-
1
is mapped on the c1 linkage group and
located on the markers between Tp179 and Thdp023,
and the genetic distance up to the Thdp023 is 10.99
cM; the
qECP
-
8
-
1
is mapped on the c8 linkage
groups and located on the markers between Sca87 and
Tp164b, and the genetic distance up to the Sca87 is
2.01 cM. The
qECP
-
8
-
2
located in c8 linkage groups
the located between to markers Tp069 and Sca602,
with the distance between the Tp069 0.01 cM. The
qECP
-
9
-
1
is mapped on the c9 linkage groups and
located on the markers between Sca901 and Tep1089,
Figure 2 Molecular linkage map of flue-cured tobacco and QTL mapping for the trait of easy curing potential