Intl. J. of Mol. Evol. and Biodivers. 2012, Vol. 2, No.1, 1-7


                http://ijmeb.sophiapublisher.com


              6
            
            
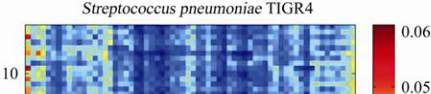
              Figure 3 The color matrix of


                Streptococcus pneumonia


              TIGR4
            
            
              Note: The horizontal axis and the longitudinal axis represent
            
            
              the kinds of combination of trinucleotide respectively
            
            
              Figure 4 The joint histogram of trinucleotide transition
            
            
              probability matrix of organisms
            
            
              Note: (a) Represents the joint histogram for both of


                Streptococcus pneumonia


              TIGR4 itself; (b) represent the joint
            
            
              histogram for


                Streptococcus pneumonia


              TIGR4 and


                Streptococcus pneumonia


              D39
            
            
              The formula used for joint histogram divergence is
            
            
              (2)
            
            
              Where


                i


              and


                j


              represent the row number and column
            
            
              number of matrix HIST respectively;


                HIST[i,j]


              represents the value of the


                i


              -th row, the


                j-


              th column
            
            
              element in matrix


                HIST


              .


                3.4 Estimation of the novel evolution analysis method


              The Euclidean distance is usually used to calculate the
            
            
              diversity between sequences based on oligonucleotide
            
            
              frequencies. And the joint histogram divergences of
            
            
              trimucleotide transition probability matrixes were
            
            
              compared with the Euclidean distances to evaluate the
            
            
              discrimination of the novel evolution analysis method.
            
            
              The Euclidean distance based on oligonucleotide
            
            
              transition probability matrixes of two genomes was
            
            
              calculated as
            
            
              (3)


                N


                1ji,


                2


                ji,


                ji,


                y x


                D


              Here


                N


              represents the row number and column
            
            
              number of oligonucleotide transition probability
            
            
              matrix;


                x


                i ,j


              and


                y


                i ,j


              represent the element value of the


                i


              -th row and the


                j


              -th column in two transition
            
            
              probability matrixes respectively.
            
            
              Additionally, the traditional method for phylogenic
            
            
              inference based on single gene or several genes has
            
            
              limited discrimination, and it cannot distinguish the
            
            
              intraspecies organisms efficiently (Bohlin et al., 2008).
            
            
              So the joint histogram divergence was used to
            
            
              reconstruct the phylogeny tree of organisms that is
            
            
              hard to be identified by single gene. Here, for 11
            
            
              organisms, their sequence alignment of 16S rRNA
            
            
              gene was completed by CLUSTAL X, and the single
            
            
              gene-based tree was constructed by neighbor-joint
            
            
              method. Meanwhile, the joint histogram divergence
            
            
              matrixes of these genomes were created and the
            
            
              phylogeny tree was constructed by PHYLIP. Finally,
            
            
              we compared the topologies of 16S rRNA gene-based
            
            
              tree with those of genomes’ joint histogram distance
            
            
              matrix-based tree to examine their ability to
            
            
              reconstruct the phylogenetic relationship among these
            
            
              11 microbial organisms. The result would be critical
            
            
              for test the validity of our new method in differentiating
            
            
              microbial species in closely related organisms.


              ) ,(
            
            
              ) ,(
            
            
              2
            
            
              ,
            
            
              ,


                j i


                ji


                j i


                HIST


                j i


                HIST


                i j


                HD


                Authors’ Contributions


              CTY collected and analyzed the data, drafted and modified the
            
            
              manuscript; QSH wrote and analyzed part of data. FZ also
            
            
              analyzed part of data; YF directed the whole project, drafted
            
            
              and modified the manuscript. All authors have read and
            
            
              approved the final manuscript.


                Acknowledgment


              This work was supported by National Science Foundation of
            
            
              China grants 10972081 and 11072080.


                References


              Amoutzias G.D., Robertson D.L., Oliver S.G. and Bornberg-Bauer E., 2004,
            
            
              Convergent evolution of gene networks by single-gene duplications in