基本HTML版本


Intl. J. of Mol. Evol. and Biodivers. 2012, Vol. 2, No.1, 1-7
http://ijmeb.sophiapublisher.com
these 100 organisms that belong to
Firmicutes,
Tenericutes
and
Proteobacteria
could be abbreviated
as “F.”, “T.” and “P.”, respectively. And
Firmicutes
consists of two classes
Bacilli
and
Clostridia
that
could be abbreviated as “F.1” and “F.2”, respectively.
The rest would be deduced by analogy. For instance,
“Clostridium beijerinckii NCIMB 8052”, whose
lineage is
Firmicutes
(Phylum 1)-
Clostridia
(Class 2)-
Clo
-stridiales
(Order 1)-
Clostridiaceae
(Family 1) -
Clostridium
(Genus 2)-
Clostridium beijerincki
(Species 2), was abbreviated
as “F.2.1.1.2.2” (Sun et al., 2010; Qi et al., 2004).
In addition, the 16S rRNA gene sequences of 11
bacteria used for evaluating our new method were also
obtained from NCBI (http://www.ncbi.nlm.nih.gov/
sites/gene/). A list of organism name, Gene ID, Taxa
ID and lineage code is given in Supplement 2.
3.2 Calculating the oligonucleotide transition
probability matrixes by Markov Chain Method
Oligonucleotide frequencies of genome sequence were
obtained with
n
or
2n
bp sliding windows, overlapped
by 1 bp each time. And the oligonucleotide transition
probability matrix was calculated by formula (1). We
know protein can be coded by both sense strand and
antisense strand of bacterial genome, so the
oligonucleotide transition probability of two chains
were computed and added together in order to gain the
overall information of genome. Ultimately, a transition
probability matrix with a dimension of
would
be obtained for each organism.
n
n
4 4
The formula used for oligonucleotide transition
probability matrix of genomes is
5
(
1
)
Where
f(w1…w
n
w
n+1
…w
2n
)
represents the frequency
of
2n
-word oligonucleotide;
f(w
1
…w
n
)
represents the
frequency
of
n
–word
oligonucleotide,
and
p(w
n+1
…w
2n
|w
1
…w
n
)
represents the probability of
w
1
…w
n
transferred to
w
n+1
…w
2n
.
According to the rule of hereditary information
transmission, the transcription and translation of
genome all involve codons pairing, and each codon
consists of three bases, representing one kind of amino
acid or stop codon. In order to combine the computed
results and the hereditary information transmission, 3 bp
sliding windows were used and a transition probability
matrix of a dimension of 64×64 was obtained.
3.3 Comparing the diversity between trinucleotide
transition probability matrixes by image registration
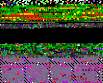
Image registration based on gray scale was used to
compare the diversity between trinucleotide transition
probability matrixes of two genomes. First of all,
transition probability matrix was changed into color
matrix, in which each element corresponds to a small
rectangular area. The values of the elements are
indices into the current colormap that determines the
color of each patch (Figure 3). Then the diversity
between color matrixes was analyzed by joint
histogram, utilizing both coloring information and
position information. Actually, the algorithm of joint
histogram is gathering statistics of the frequencies of
different gray scale pairs. Firstly, a matrix of a
dimension of M×N was defined, which could be
expressed as
HIST[M, N]
, where
M
and
N
represented
the gray scale of the image
A
and image
B
respectively.
Secondly,
i
was defined as pixel, so
A(i)
and
B(i)
represent the gray scale of the i-th pixel of the image
A and image B, respectively. Finally,
HIST[A(i)
,
B(i)]
+1 was defined for each pixel i A∩B. The last
∈
HIST[M, N]
which matrix consists of the data of joint
histogram between image
A
and
B
will be obtained
and the profile of joint histogram could be plotted by
software (Mei et al., 2007). Therefore, if the image A
is more similar with B, the map of the joint histogram
of these two images approaches more closely to a
straight line of 45 degree. On the contrary, it will be
more divergent (Figure 4).
ww
w www www w
n
1
2n
1n n
1
n
1
2n
1n
f
f
|
p
Consequently, the divergent degree of joint histogram
could be served as a measurement for the diversity
between two images. In other words, it can be used to
estimate the diversity between two genomes. The
divergent degree of joint histogram was calculated by
formula (2) (Mei et al., 2007). Thus, the joint histogram
divergence will increase with the difference enlarging
between two genomes. The color images and the joint
histograms distances were obtained by MATLAB.