Molecular Plant Breeding 2016, Vol.7, No.19, 1
-
9
7
1.5 Biplot analysis
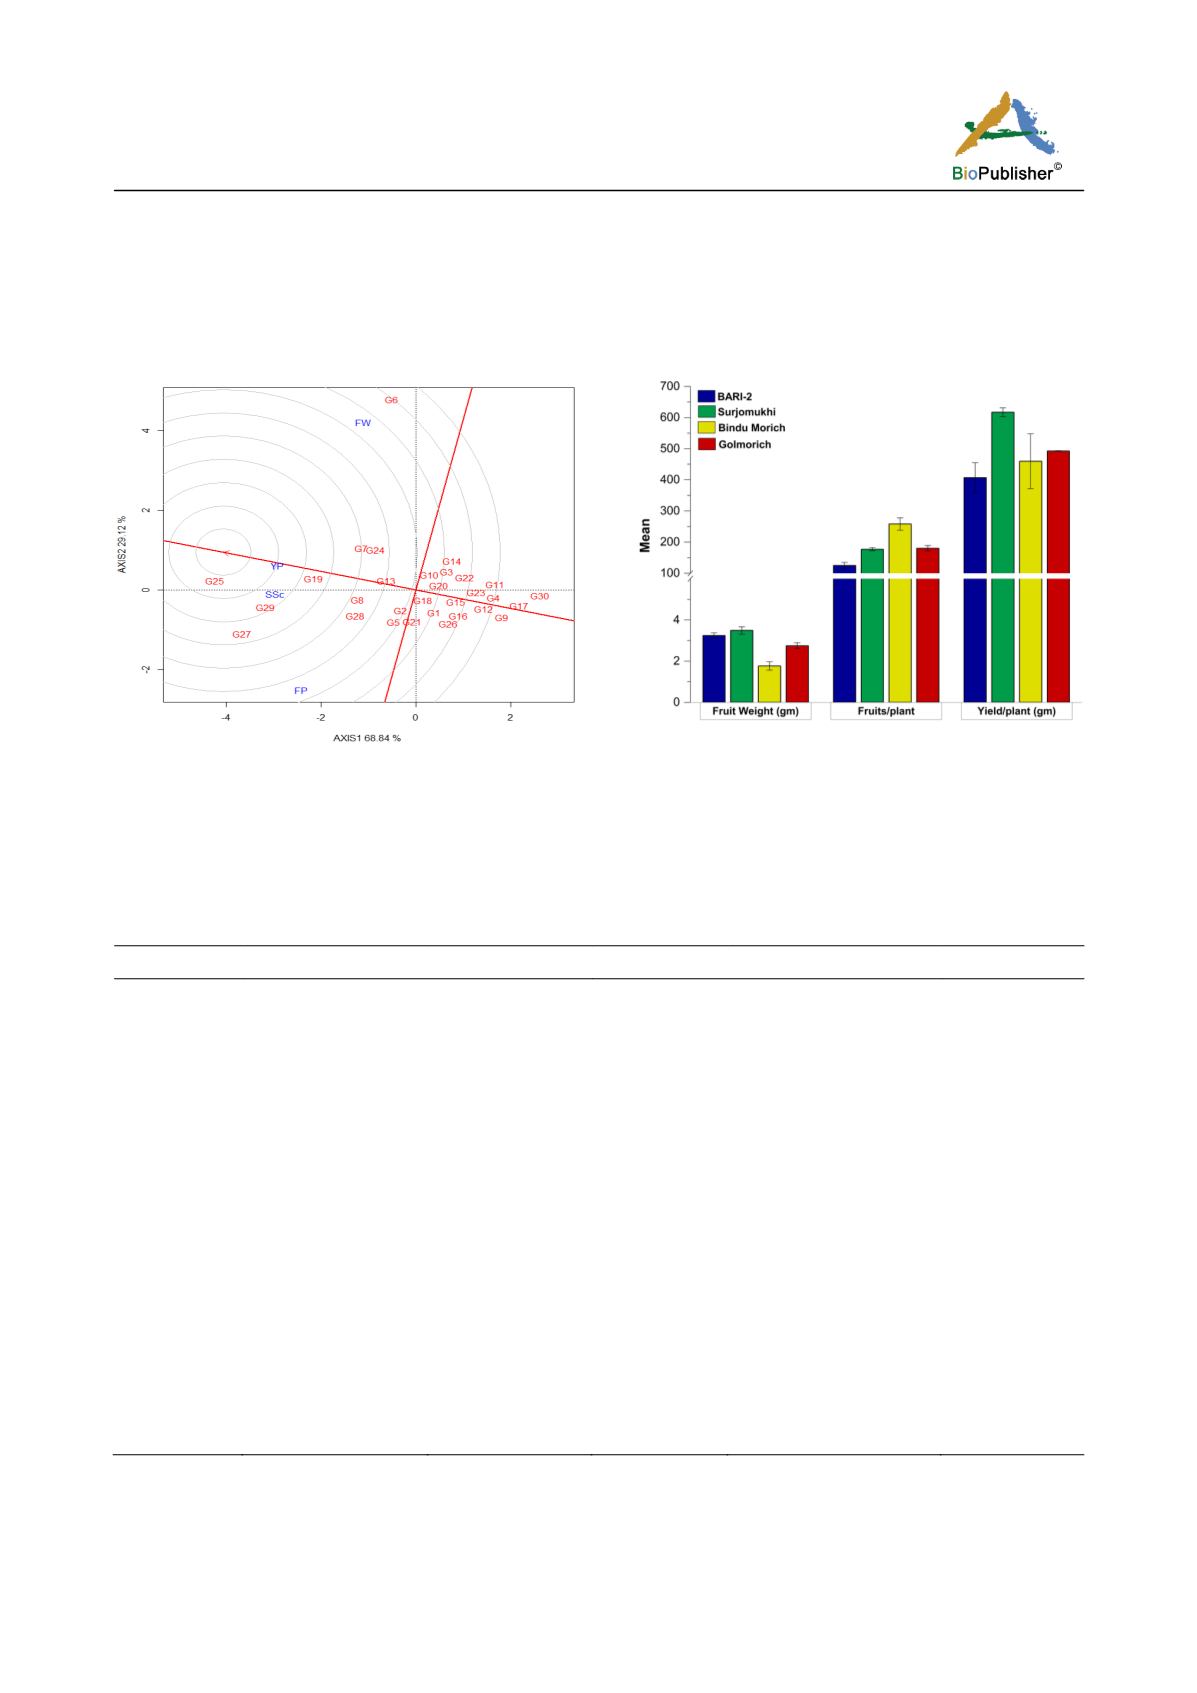
Superior genotypes were easily identified through biplot analysis (Figure 2). The genotype closer to the arrow
mark refers ideal genotype. Genotype G25 was situated in second concentric circle and was also close to arrow
mark indicating most superior genotype followed by G29, G27 and G19. Figure 3 showed mean performance of
selected genotypes.
Figure 2 Selection of genotypes based on the best selection
index (X3 + X4 + X5) with mean value and relative
genetic score using Biplot method
Note: FW= Fruit weight, FP= Fruits/plant, YP= Yield/plant,
SSc= Selection Score
Figure 3 Mean performance of superior genotypes according to
best characters combination
Table 5 Chilli genotypes used in the experiment
Genotype code Name of the genotype Place of collection
Genotype code Name of the genotype
Place of collection
G1
Potuakhali
Potuakhali
G16
Co613
Comilla
G2
Co525-3
Unknown
G17
Tsu Buka
Japan
G3
Bodorgonj morich
Rangpur
G18
BARI morich-3
BARI
G4
Co611-1
Gazipur
G19
BARI morich-2
BARI
G5
Co525-1
Magura
G20
Co610
Unknown
G6
Ruba bhutan
Bhutan
G21
Ramgar
Khagrachhori
G7
BARI morich-1
BARI
G22
Ramnagar laxmi 20
Laxmipur
G8
Co611-2
Gazipur
G23
Moheshkhali
Cox'sbazar
G9
Co621-2
Noakhali
G24
Balughuri
Jamalpur
G10
Co525-2
Magura
G25
Surjomukhi
Unknown
G11
Halda morich
Khagrachhori
G26
Dosmina
Jessore
G12
Current morich
Dinajpur
G27
Bindu morich
Manikgonj
G13
Co620
Gazipur
G28
BARI-1 X 610
BARI
G14
Cox'sbazar morich
Cox'sbazar
G29
Golmorich
Kustia
G15
Co446
Magura
G30
Boot morich
Unknown
2 Materials and Methods
2.1 Experimental materials
The materials for present investigation comprising of thirty genotypes of chilli (
Capsicum annuum
L
.
) were


