International Journal of Marine Science 2016, Vol.6, No.54, 1-8
4
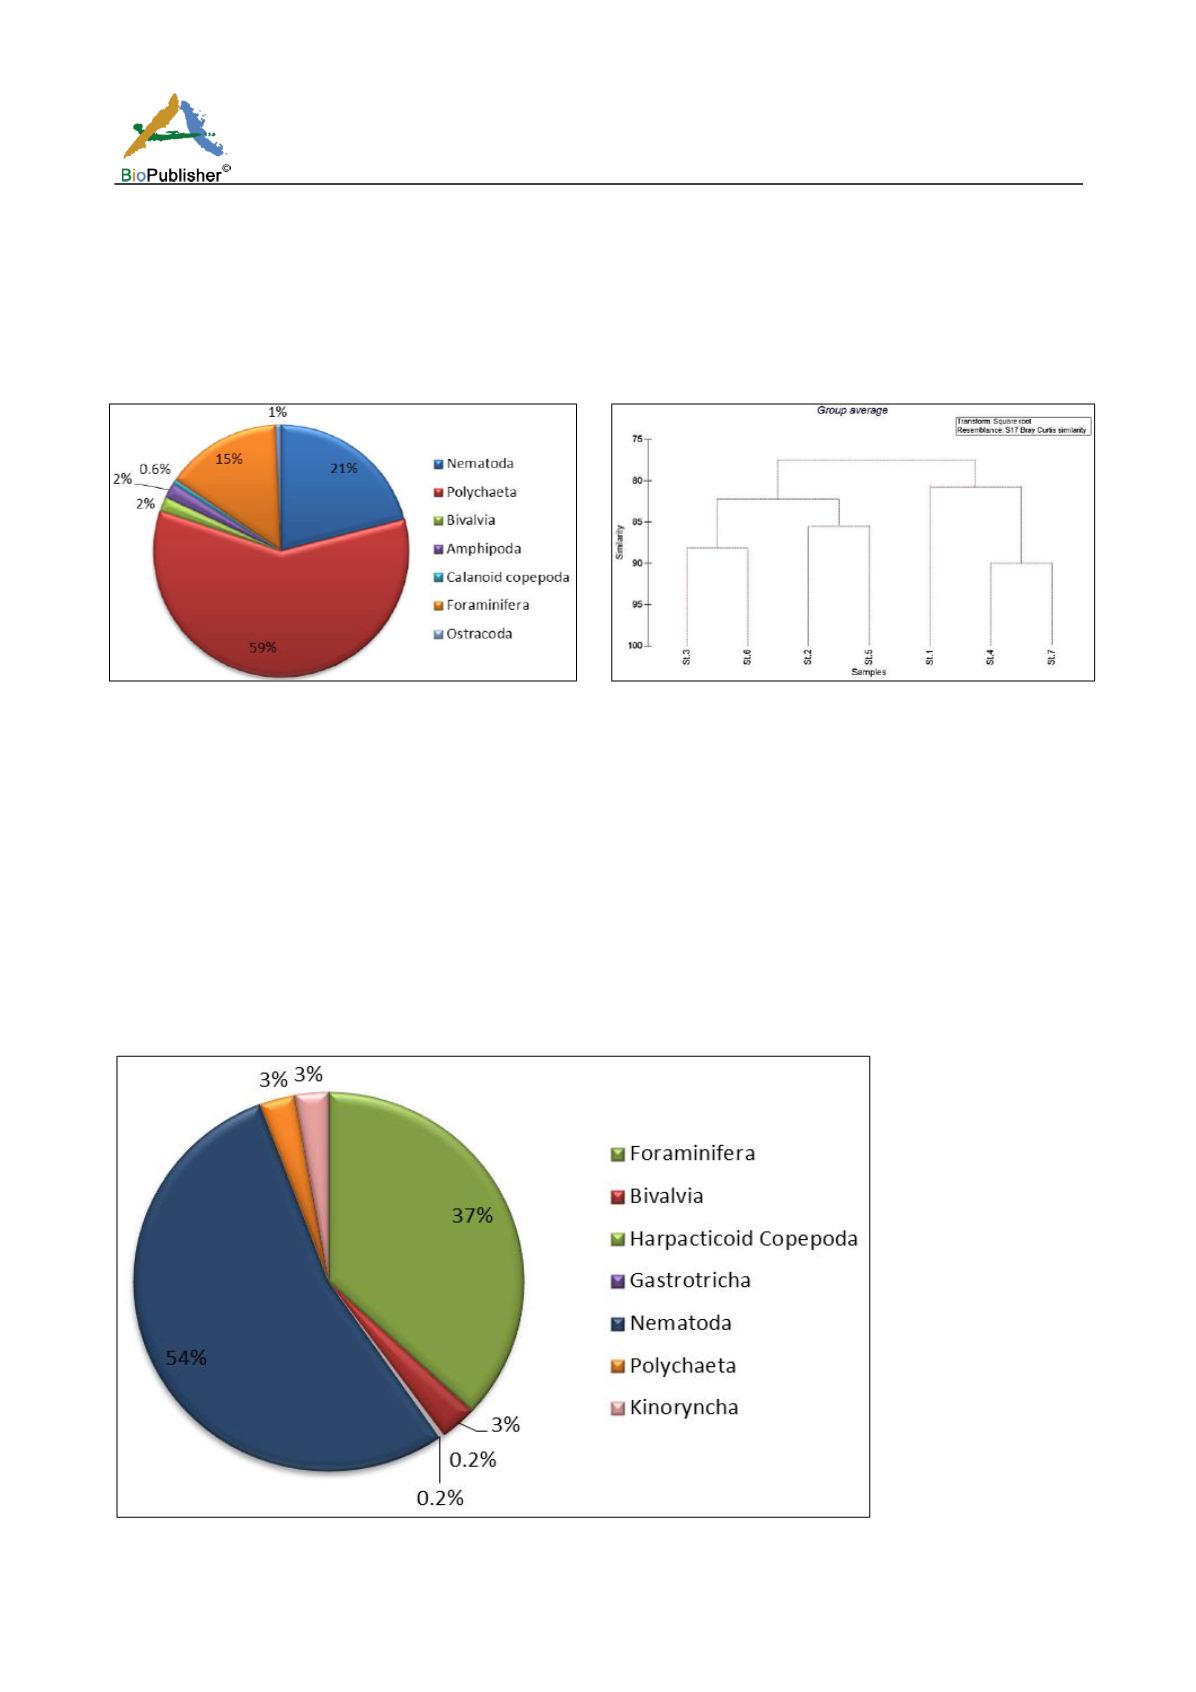
and 1.72 in the outer fjord. The multivariate analysis of macrofaunal abundance formed two major clusters with ~ 80%
similarity. Stations 2, 3, 5 and 6 represented cluster 1 and stations 1, 4 and 7 in cluster 2. Highest similarity in
abundance was observed in stations 4 and 7 (90%) of cluster 2 (Fig. 3). A permutation based hypothesis testing
ANOSIM (one way) was done to find out whether there is any significant variation in the distribution of macro
fauna between inner and outer fjord. Similarity analysis (ANOSIM) indicated that there was no significant
variation in the distribution of macro fauna between inner and outer fjords (Global R = 0.074, P < 0.001).
Fig. 2 Mean percentage composition of macro fauna in the
Kongsfjorden system
Fig. 3 Dendrogram representation of square - root transformed
data of macrofaunal abundance of Kongsfjorden system
Benthic meiofauna
-
composition, abundance and diversity
Seven meiofaunal groups were recorded in the summer months of Kongsfjorden glacial system that was
constituted of Nematoda, Foraminifera, Bivalvia, Polychaeta, Harpacticoid copepoda, Gastrotricha, and
Kinoryncha. Maximum numerical abundance of the taxa was recorded in station 2 (2273 ind. /10 cm
2
) followed
by station 1 (2154 ind. /10 cm
2
) and station 3 (1862 ind. / 10 cm
2
) respectively. Nematoda was the numerically
dominant taxon in every station, constituting a minimum of 54% of total meiobenthic abundance. The percentage
abundance of other subdominant taxa were, Foraminifera (37 %), Harpacticoid copepoda (0.2%), Bivalvia (3.1 %),
Gastropoda (0.2 %), Polychaeta (3 %) and Kinoryncha (3%) (Fig. 4). Nematodes formed the abundant group both
in the inner and outer fjords with a percentage abundance of 47% in the inner fjord and that of 52.7% in the outer
fjord.
Fig. 4 Mean percentage composition of meiofauna in the Kongsfjorden system


