Basic HTML Version


International Journal of Marine Science 2014, Vol.4, No.54, 1-10
http://ijms.biopublisher.ca
7
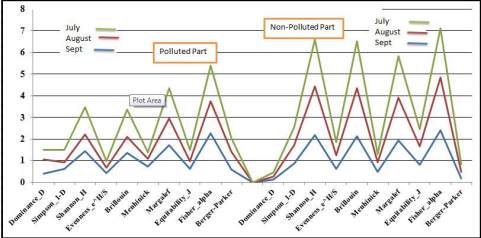
Figure 4 Biodiversity indexes in south (more polluted) and north (low-polluted) parts of Miangaran wetland in summer 2011
the south part of Miangaran wetland, which more
effect on chemical compounds of water in south part
than in north part. PH, EC, Turbidity COD, BOD,
NO3, SO4 and temperature of water for both Part
(south and nourt) of wetlands were measured in 10th
July, August and September 2011 (Table 5) by
Standard Methods 2005 (part 2000-2810). All
Physicochemical parameters of south part (more
polluted) were higher than north part (Table 5), except
DO was inverse (4.66 mg/L in north part>2.9 mg/L in
south part) (Table 5). A little difference between
average of these parameters of water at two parts of
marsh have been cased significantly in number,
species diversity and richness of waterbirds in south
and north part of marsh in summer 2011. Pollutants
both directly and indirectly threatened birds [10]. For
example, Nutrients and sediments from agriculture,
urban, runoff, industries and other sources entering
Chesapeak Bay, have increased alga bloom, decreased
oxygen levels and invertebrate populations. This has
decreased sea grasses and population depended upon
sea grasses [26]. There were negative correlation
between physicochemical parameters of water and
number of birds in marsh (Table 6). Biodiversity
indexes were also more in north than in south part of
marsh (Table 4).
Table 5 Selected physicochemical Parameters in Miangaran marsh in summer in 2011
North part
part
South part part
Parameters
July
August
Sept.
Average
July
August Sept.
AAverage
PH
7.7
7.19
7.59
7.49
8.9
7.56
8.06
8.17
DO(mg/L)
2.7
3.7
7.6
4.66
2.1
2.5
4.1
2.9
Sal (mg/L)
0.8
1.1
1
0.96
1.02
1.2
1.35
1.19
T (siliceous)
22
21
18
20
22
23
20
21.6
EC(µs/cm)
0.49
0.79
0.68
0.65
0.58
0.89
0.9
0.79
Tur.(NTU)
2
2.2
1.7
1.96
3.4
3.8
3.1
3.43
BOD(mg/L)
48
50
52
50
51
55
67
57.66
COD(mg/L)
87
89
99
91.66
99
105
102
102
SO4(mg/L)
NO
0.46
0.67
0.71
0.61
0.63
0.82
0.91
0.76
o3(mg/L)
2
6
3
3.66
2.2
8.4
3.2
4.6