Basic HTML Version


International Journal of Marine Science 2014, Vol.4, No.65, 1-7
http://ijms.biopublisher.ca
6
Table 3 Percentage of coral cover
Station
Precentage of coral cover (%)
Acopora
Non acropora
Soft coral
Dead Coral
Abiotic
Other Biota
MCN1
16.45
15.13
16.15
24.73
27.28
0.28
TGL2
13.55
15.38
33.83
31.63
4.38
1.25
GSN3
1.09
28.19
36.31
24.69
9.72
0.00
LHK4
39.98
6.03
17.28
32.53
4.20
0.00
PGK 1
35.59
10.56
4.56
16.47
32.38
0.44
PGK 2
4.10
26.50
6.40
47.00
16.00
0.00
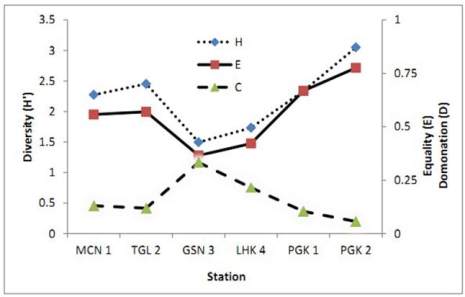
that the coral communities threatened. Three stations
(MCN1, TGL2 and PGK1) classified as moderate
rates of quality, in distrubed coral communities.
Station PGK2 recorded E> 0.75 that categorized as
high rate, it means the coral community is stable
(Figure 2).
Figure 2 Graph Diversity, Equality, and dominance of coral
communities
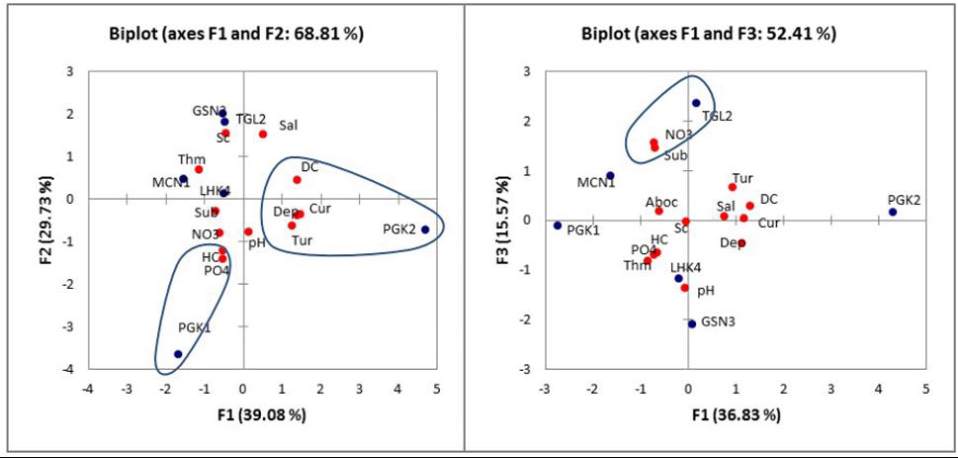
2.1.3 Relationship between the characteristics of water
environment with soft coral covers percentage
Based on of principal component analysis (PCA),
cumulative Eigenvalues were 85.62% and a variable
minimum 0.495 squared cosines value illustrated that
there were three groups of data with each identifier.
Two groups were in axes F1 dan F2 dan another was
axes F1 dan F3 of correlation circle (Figure 3).
Description of the three groups of PCA is as follows;
First group
includes PGK2 station, the identifiers is
the depth, currents, turbidity and dead coral. Depth at
this station reaches 9 meters, with dominance by dead
coral cover (DC) of about 47%, hard coral is about
30.6% dominated by massive coral of the family
Faviidae (22.7%). While the soft coral cover is only
about 6.4%. The current speeds are strong enough
about 0.5 m.sec
-1
. Turbidity is high but still below the
quality standard for coral (>10 NTU).
The second
group
involves PGK1 station with, the identifiers of
Figure 3 Principal Component Analysis