Basic HTML Version


International Journal of Marine Science 2014, Vol.4, No.42, 1-11
http://ijms.biopublisher.ca
7
Table 3 Summary of values of chl-a concentration in the study area
Study sites
1
2
3
Min Max Mean ±SD
Min Max Mean ±SD
Min Max Mean ±SD
Chl-a in water
0.32 1.9 20.95±0.58
0.46 2.01 0.82 ±0.6
0.12 1.13 0.83 ±0.36
Chl-a in sediment
0.14 0.91 0.65 ±0.29
0.36 1.2 10.42 ±0.15 0.35 1.31 0.46 ±0.5
Figure 7 Variation of chl-a in water at the study stations during
the dry season
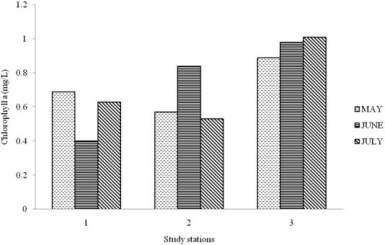
Figure 8 Variation of chl-a in water at the study stations during
the wet season
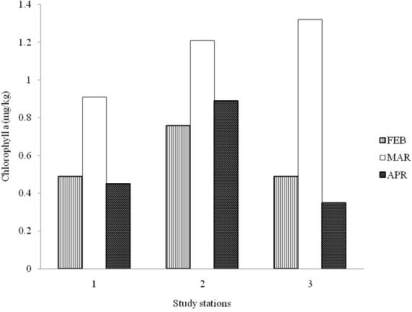
Figure 9 Variation of chl-a in sediment at the study stations
during the dry season
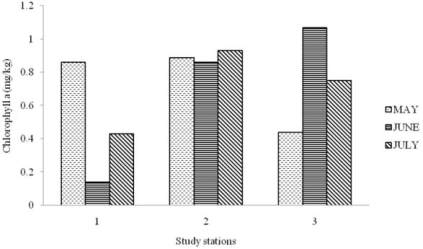
Figure 10 Variation of chl-a in sediment at the study stations
during the wet season
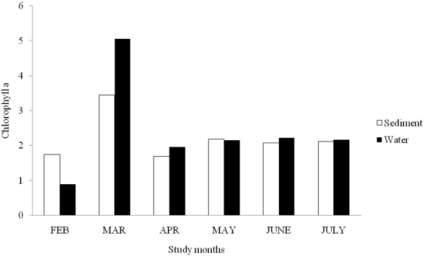
Figure 11 Temporal variation in chl-a during the study period
The amount of chl-a in sediment was highest (3.44 mg/g)
in the month of March and lowest (1.99 mg/g) in the
month of April. Total chl-a values recorded for the
other sampling months were; 2.14 mg/g in February,
2.11 mg/g in May, 2.57 mg/g in June and 2.32 mg/g in
July. Monthly concentrations of chl-a in sediment in
the study area varied between 0.49 – 0.89 mg/g in
February, 0.91 – 1.32 mg/g in March, 0.35 – 0.89
mg/g in April, 0.44 – 0.86 mg/g May, 0.64 – 1.07
mg/g in June, and 0.53 – 0.93 mg/g in July. Chl-a in
sediment was significantly different (ANOVA, F
=1.927,
p >
0.05) during the sampling months, with
values significantly lower in the months of February,
April, and May, but significantly higher in March, June
and July. However, values of chl-a in sediment were