International Journal of Marine Science, 2017, Vol.7, No.12, 102-113
103
turbidity, substrate composition, sedimentation rates and bathymetry) play significant role on benthos composition,
abundance and distribution (e.g. Bromley, 1996; Olenin, 1997; Coleman et al., 2007).
There are many previous studies on benthos around the world but in Bangladesh the information on benthos is still
scarce. For instance, Sharif (2002) and Hossain (2009; 2011) contributed some information on the macrobenthos
of the Meghna River estuary but further research is needed. Therefore, this shortage of information led us to
conduct research on benthos with the main aims of 1) characterizing the occurrence and distribution pattern of
benthos in the lower Meghna River and its estuary, and 2) exploring the physico-chemical variables that may
affect the benthic assemblage.
1 Materials and Methods
1.1 Study area
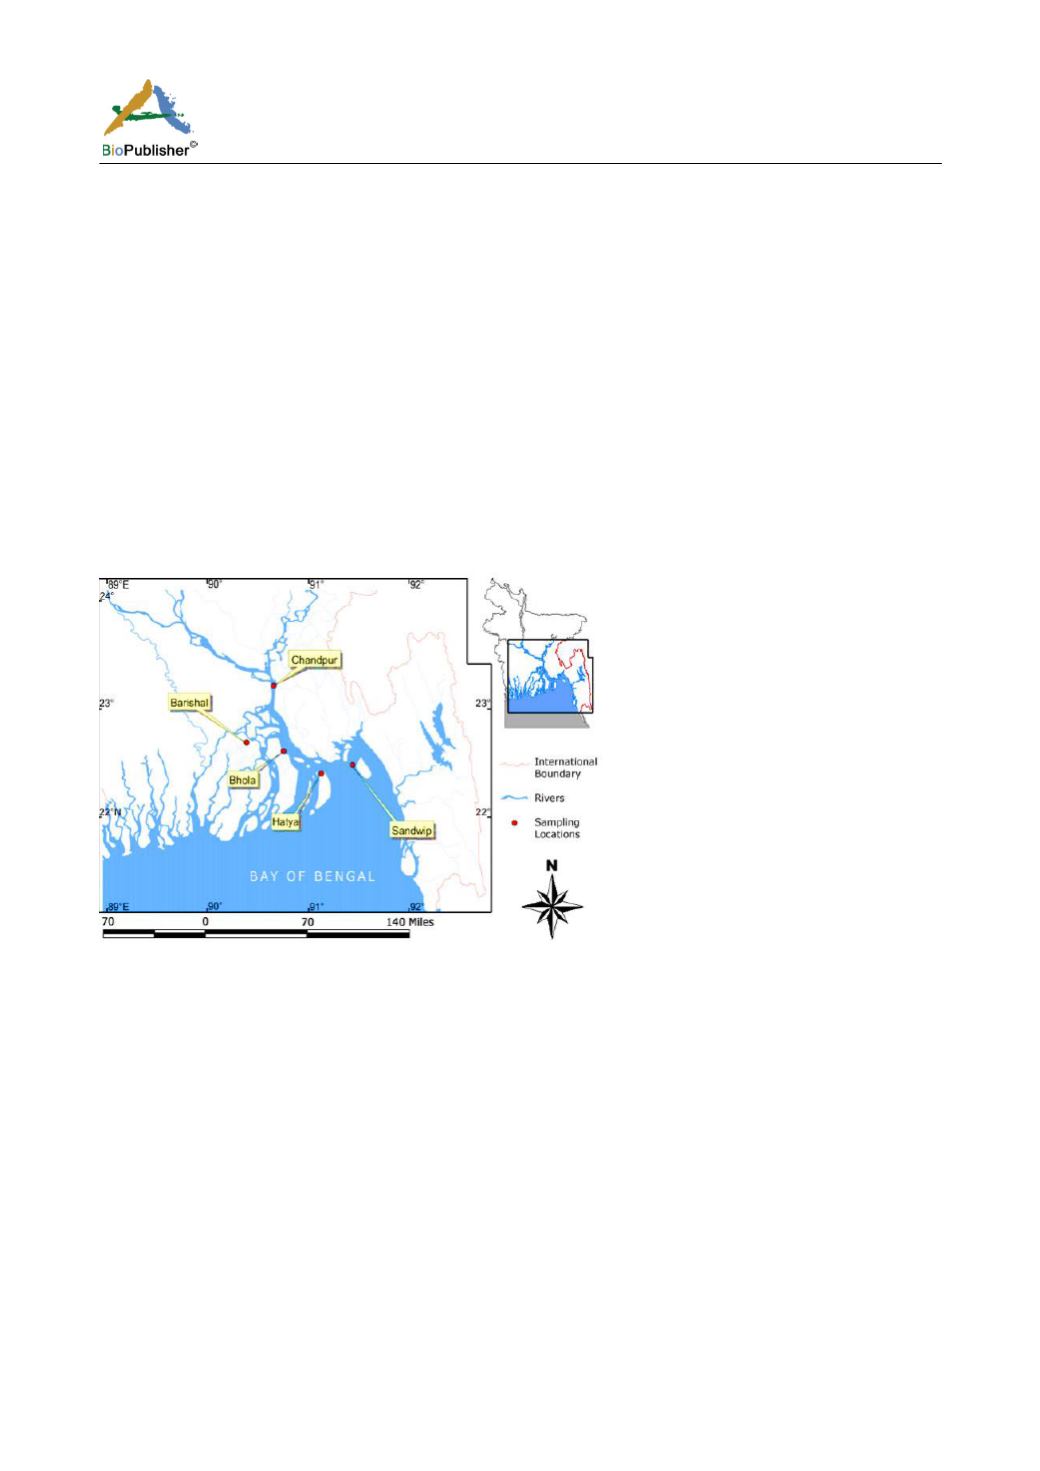
The present study was conducted at Chandpur (23°13.768'N, 90°38.58'E), Barisal (22°41.962'N, 90°22.524'E),
Bhola (22°37.153'N, 90°44.562'E), Hatiya (22°24.459'N, 91°07.013'E) and Sandwip (22°29.319'N, 91°25.668'E).
The area of this investigation ranged from the lower Meghna River at Chandpur to estuarine near-shore coastal
water of Sandwip. Five selected sampling sites were being located from the lower Meghna to its estuary (Figure
1). The depth of the investigation sites were of 4-13 m and total length of the study area was about 172 miles.
Figure 1 Map showing sampling sites
1.2 Sampling
The voyages were conducted on board passenger ships of Bangladesh Inland Water Transport Authority (BIWTA)
during monsoon and post-monsoon seasons from the study sites at Sandwip, Hatiya, Bhola, Barisal and Chandpur.
Water samples were collected by a one liter Kemmerer water sampler from the surface (Table 1) and sub-surface
(at 3 m depth) (Table 2) from each site. A Petersen Grab Sampler (APHA, 1974; Suess, 1982) having an opening
of 0.024 m
2
was used to collect sediment samples. At each site, 4 grabs were collected for benthos identification
and 2 grabs for analysis of sediment physico-chemical parameters.
1.3 Surface and sub-surface water analysis
The
in situ
air and water temperature were recorded using a Graduated Centigrade Thermometer; water pH was
determined using pH paper (color pH ast ®, pH, indicator, strips, Cat.9582. Made in Germany); turbidity was
measured using a white secchi disc of 30 cm diameter (Pipkin et al., 1977); water salinity was determined using a
hand held refractometer (ATAGO, S/Mill, salinity. 0-100‰, Japan). Dissolved Oxygen concentration was
determined by the Winkler titration Method (H. O. PUB. No. 607. 1955); Total Suspended Solids (TSS) and Total
Organic Matter (TOM) were determined following Jin-Eong et al. (1985). BOD was determined by light and dark
bottle method (APHA, 1974). Alkalinity, H
-
CO
3
and CO
2
were determined following APHA (1975).


