International Journal of Horticulture, 2017, Vol.7, No. 29, 262-274
265
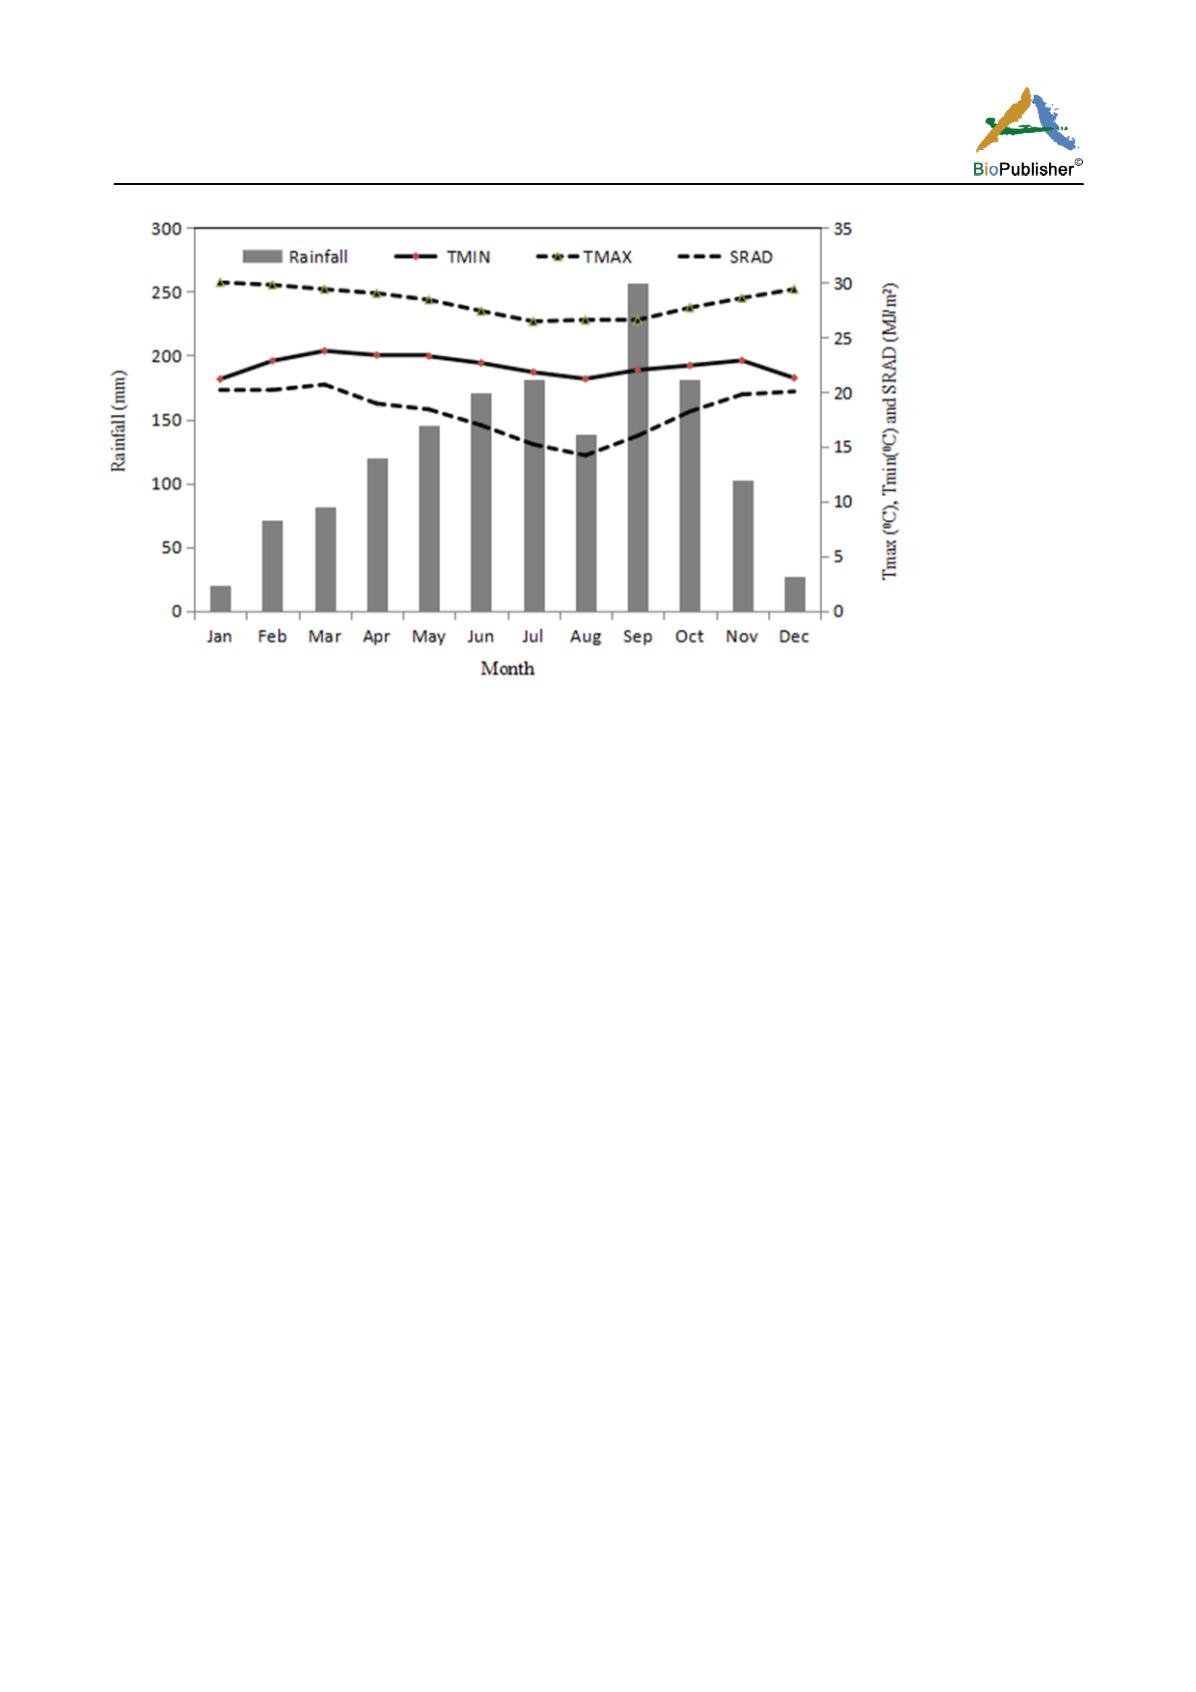
Figure 1 Mean climatic condition of the experimental site 2013-2014
Experiment 2: Growth and development response of green pepper to fertilizer application and planting dates under
rainfed and irrigated conditions:
Drip irrigation was adopted because it minimizes water loss and stem or crown of the crop will not be covered
with water. Time of irrigation was adapted from the meteorological report of the environment. (November to
March). Soil Parameters determined include soil moisture at saturation, field capacity to calculate and determine
irrigation schedule and proper irrigation.
Fertilizer treatment and rate: Inorganic fertilizer (N.P .K) at the rate of N60kg, P
2
O
5
32 kg and 20kg K
2
O, 10
tons/ha Organic fertilizer (SOF), 5 ton/ha Organomineral fertilizer (OGM) and the control (No fertilizer
treatment).
Experimental Design: The experimental design was spilt-split plot (4 planting dates x 4 N fertilizer sources x 2
Green Pepper varieties x 3 replications) experiment in RCBD. The first split was the planting date as the main plot,
the fertilizer levels as the subplot and the Green Pepper varieties from the sub-sub plots in three replicates. The
experiment was laid out in a completely randomised design with three replicates. The treatments imposed were
three types of fertilizers: 100% Sunshine organomineral fertilizer at 5 t/ha; 100% Organic fertilizer (Sunshine
organic fertilizer SOF) at 10t/ha; 100% Inorganic fertilizer (Urea); Control (No fertilizer). The organomineral
fertilizer was evenly mixed with the soil two weeks before transplanting. The organomineral fertilizer was a
commercial fertilizer and has the following composition; organic carbon 8.34, organic matter content 14.38,
nitrogen 4.424 g/kg, calcium, 2.8, magnesium, 3.87, available phosphorus 7.04 and exchangeable potassium 0.352;
Data were collected fortnightly beginning at 4 WAT from two plants in each plot for the following growth and
yield parameters; plant height (cm), number of leaves per plant, number of branches per plant, fruit weight (g),
days to 50% flowering, number of fruits per plant, harvested weight, harvest index among others. Plant height was
assessed by using a measuring tape from the base to the terminal point of the plant, number of leaves and the
number of branches was visually counted. At harvest, the plants were uprooted and weighed using a sensitive
weighing balance. Analysis of variance (ANOVA) for all measurements were performed using Genstat software
version 12 statistical packages and mean separation was done based on the work of Steel and Torrie (1980).
3 Result and Discussion
The Figure 1 shows the mean climatic condition of the study site between the years 2013-2014 to cover the
experimental years. The maximum mean temperature is in a range of 26
°
C - 30
°
C and a mean of 28
°
C while the


