International Journal of Aquaculture, 2018, Vol.8, No.5, 29-37
32
the three seasons. Therefore, 74 parasites were observed in total over the study period. The analysis of variance (
F
test) showed that the effect of seasons on the prevalence of the parasites was significant,
F
(2,597) = 24.04,
(
p
<0.05). The prevalence rates of the observed parasites during the three seasons are shown in the Figure 3.
Figure 3 The prevalence rates of parasites during the cold, dry and rainy seasons
The lowest prevalence rate was observed during the cold season. The prevalence rate for the cold season was 0%
for the parasites targeted by the study. On the other hand, the highest prevalence rate of 21% was noted during the
dry season indicating high infection rate during that time of the year. The rainy season registered a prevalence rate
of 13%. This indicates that parasites were also observed during the rainy season in fresh
E. sardella
species. The
seasonal changes also showed variations in the mean intensity of the parasites in fresh
E. sardella
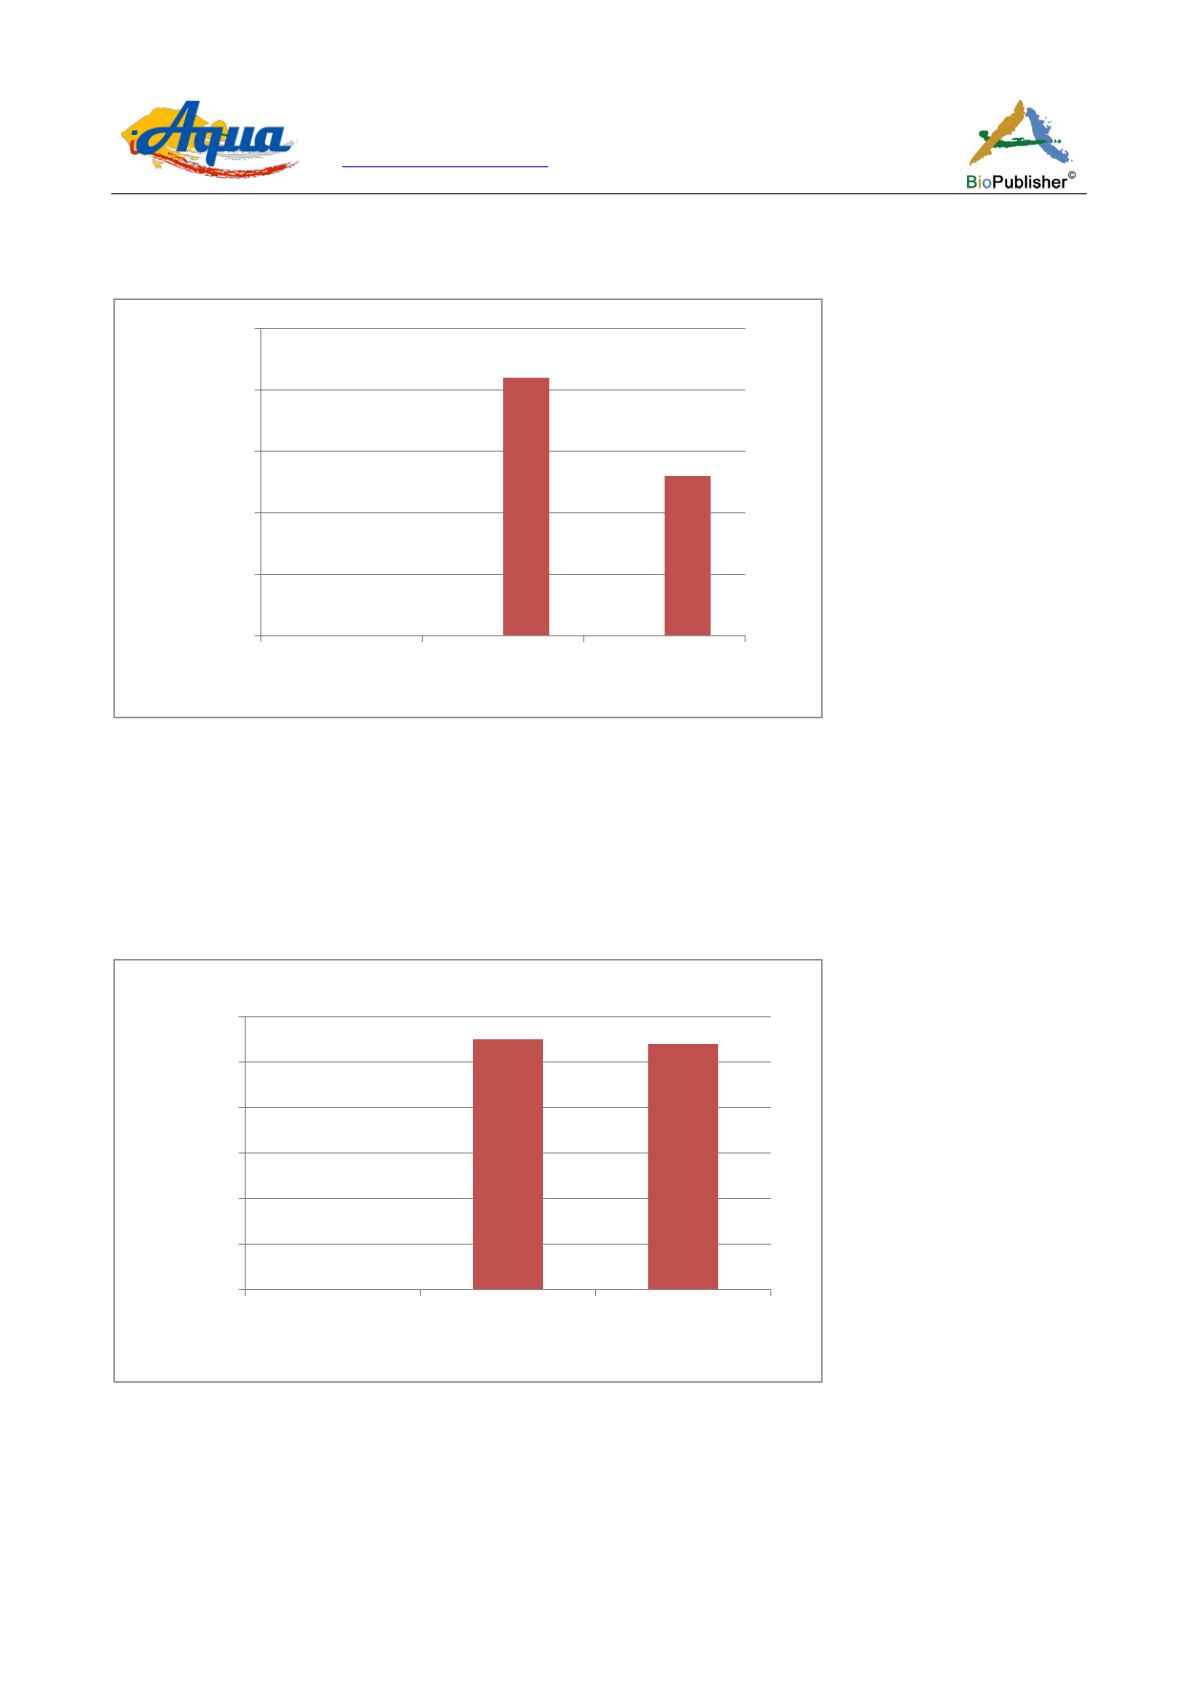
. Figure 4 shows
the mean intensities of the parasites during the study period.
Figure 4 The mean intensity of parasites during the cold, dry and rainy seasons
The cold season had mean intensity of 0 while the dry season had a mean intensity of 1.1. The rainy season had a
mean intensity of 1.08 which is almost the same as the dry season. Finally, multiple comparisons tests using the
Tukey’s HSD and Bonferroni criteria for significance indicated that the differences of the parasitic loads among
the seasons were statistically significant. The pair-wise comparisons of the parasitic loads were significant
(
p
<0.05).
0
21
13
0
5
10
15
20
25
Cold season
Dry season
Rainy season
Seasons of the year
Parasites
prevalence rate
0
1.1
1.08
0
0.2
0.4
0.6
0.8
1
1.2
Cold season
Dryseason
Rainy season
Seasons of the year
Parasites
mean intensity


