International Journal of Aquaculture, 2017, Vol.7, No.1, 1
-
8
4
resulted in fish fed diets control and diet D4 (41.1 and 52.4 mg/dl respectively).
Table 2 The effect of moringa leaves meal as feed additive in the diets for juvenile Nile tilapia
Oreochromis niloticus
(initial wt 2.1 ±
0.1 g) for 12 weeks, Values are mean ±SD of triplicate groups
Values
0 g/kg
2 g/kg
4 g/kg
6 g/kg
FBW (g fish
-1
)
9.2 ±0.8
8.6 ±0.8
8.4 ±0.5
8.0 ±1.0
TWG (g fish
-1
)
7.0 ±0.8
6.5 ±0.8
6.3 ±0.4
5.9 ±1.1
WG (%)
†
333.6 ±31.2
320 ±38.5
297.5 ±6.4
277.6 ±60.5
SGR (% day
-1
)
‡
1.7 ±0.1
1.7 ±0.1
1.6 ±0.02
1.6 ±0.2
FI (g fish
-1
)
15.3 ±1.6
15.1 ±0.8
14.0 ±0.9
14.0 ±1.6
FCR
§
2.2 ±0.2
2.3 ±0.2
2.2 ±0.1
2.4 ±0.2
FER
0.46 ±0.04
0.43 ±0.03
0.45 ±0.02
0.42 ±0.04
PI (g)
3.8 ±0.4
3.7 ±0.2
3.5 ±0.2
3.5 ±0.4
PER¶
1. 8 ±0.2
1. 7 ±0.1
1.8 ±0.1
1.7 ±0.2
Survival %ǁ
97.3 ±1.2
98.2 ±1.1
97.3 ±1.5
96.3 ±1.3
Note: *Values in the same row with the same superscript are not significantly different (
P > 0.05
)
†WG (%) = 100 ×(final body weight – initial body weight)/initial body weight
‡SGR (%/day) = 100 ×(Ln final weight – Ln initial weight)/Time (days)
§FCR = Total feed consumed (g fish
-1
)/weight gain (g fish
-1
)
¶Protein efficiency ratio (PER) = weight gain (g fish
-1
)/protein intake (g)
ǁSurvival rate (%) = [(no. of fish at the end of the experiment / no. of fish at the beginning of the experiment)] ×100
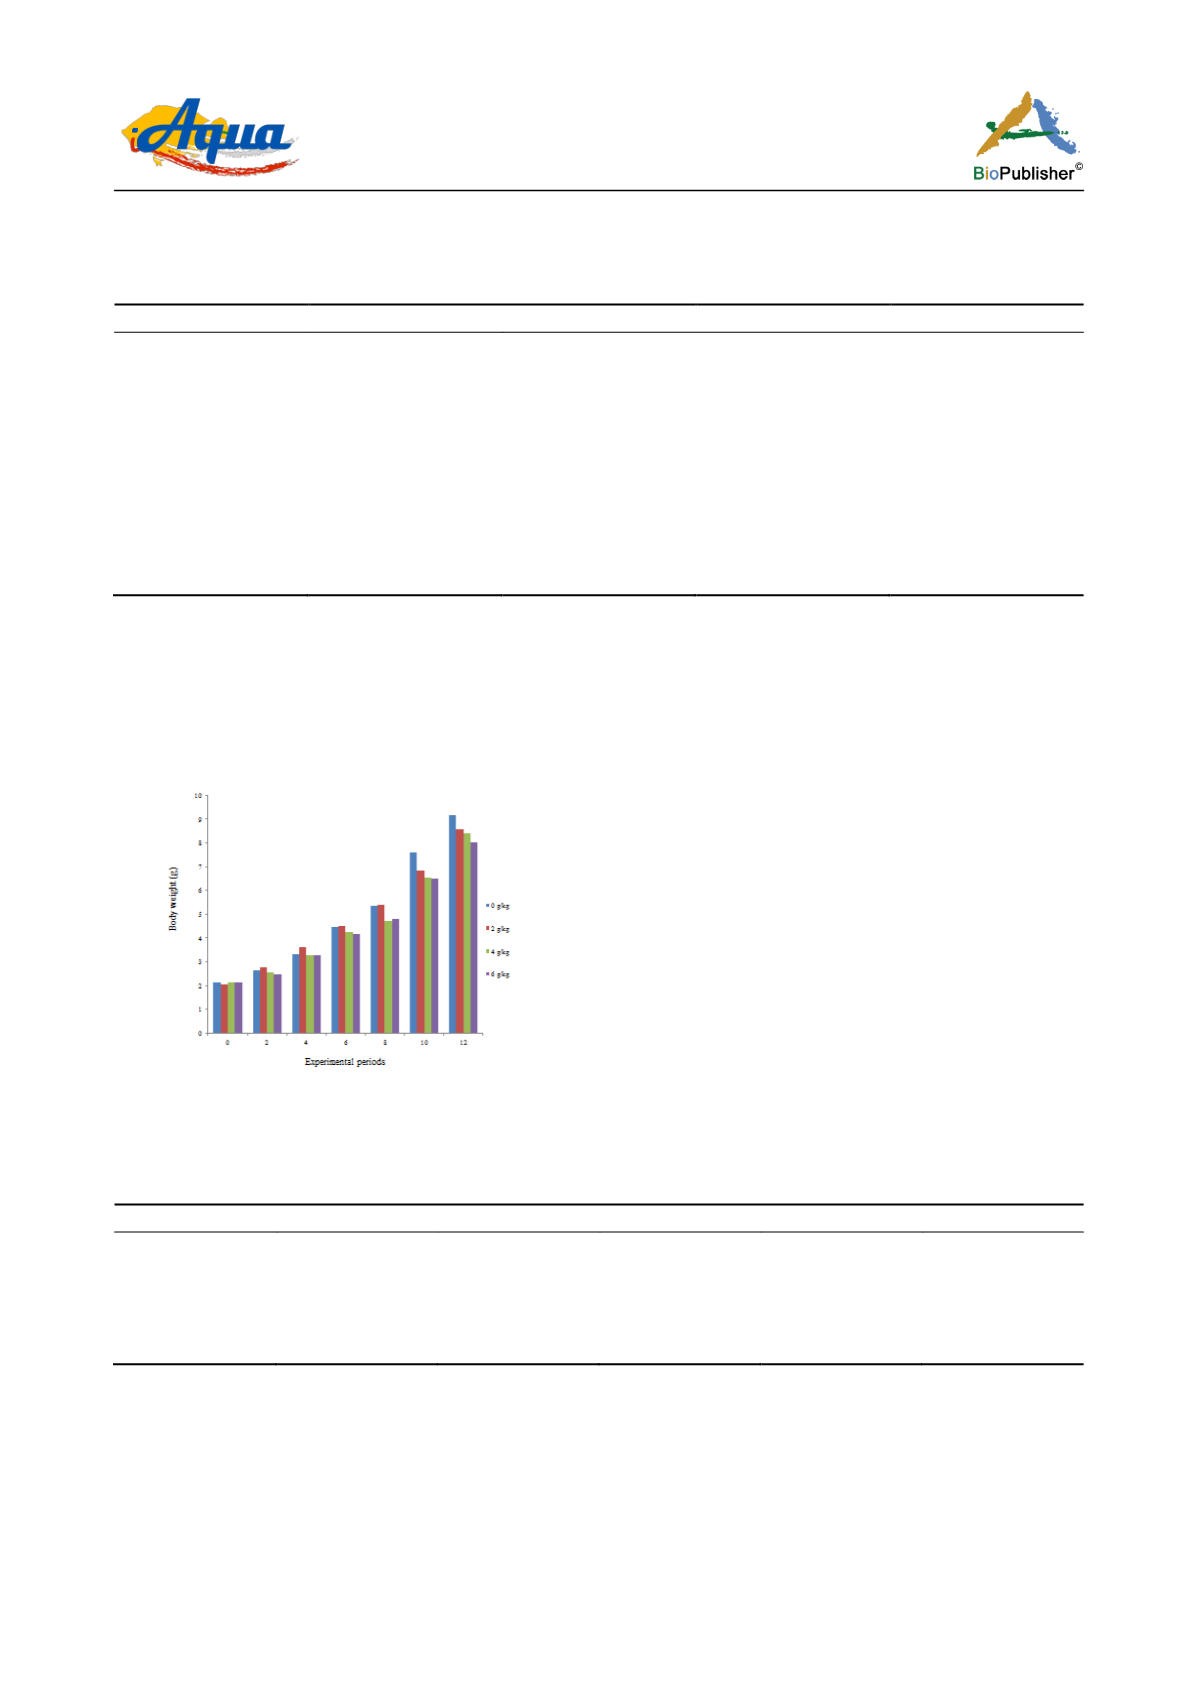
Figure 1 Body weight (g) of juvenile Nile tilapia
Oreochromis niloticus
(initial wt 2.1 ± 0.1 g) fed the experimental diets with
different (0, 2, 4 and 6 g kg
-1
)levels of moringa leaves meal as feed additive for 12 weeks, Values are mean ±SD of triplicate groups
Table 3 Body composition (% dry basis) of juvenile Nile tilapia
Oreochromis
niloticus
(initial wt 2.1 ±0.1 g) fed the experimental
diets with different levels of moringa leaves meal as feed additive for 12 weeks, Values are mean ±SD of triplicate groups
Feed additive (g/kg)
Items
Initial
0
2
4
6
Moisture
70.1
73.5 ±1.5
a
74.1 ±0.3
a
76.2 ±0.1
a
72.5 ±2.4
a
Protein
64.8
66.2 ±0.5
c
64.5 ±1.1
bc
53.3 ±2.3
a
62.4 ±1.1
b
Lipid
12.9
17.5 ±0.0
c
18.1 ±0.1
b
19.9 ±0.6
d
16.3 ±0.2
a
Ash
10.3
8.6 ±2.5
c
8.5 ±0.1
b
8.0 ±0.01
a
12.2 ±0.0
d
Note: Values followed by the same superscript letters in the same row are not significantly different (
P
> 0.05)
2.4 Histology
Liver histology from fish fed control and supplemented diets with different levels of moringa leaves meal (2, 4
and 6g kg
-1
) for 12 weeks are briefly illustrated in Figure 1. In the control group, congestion was observed in the
central veins accompanying with focal inflammatory cells infiltration in the hepatic parenchyma (Figure 2 A). The
hepatic parenchyma of fish fed diet supplemented with moringa leaves meal at 2 g kg
-1
showed no alterations but


