International Journal of Aquaculture, 2016, Vol.6, No.22, 1
-
11
7
(5.64 ±0.09 mg/l) and lowest in station B (4.23 ±0.06 mg/l).There was significant difference among the stations
during the study period (Table 3).
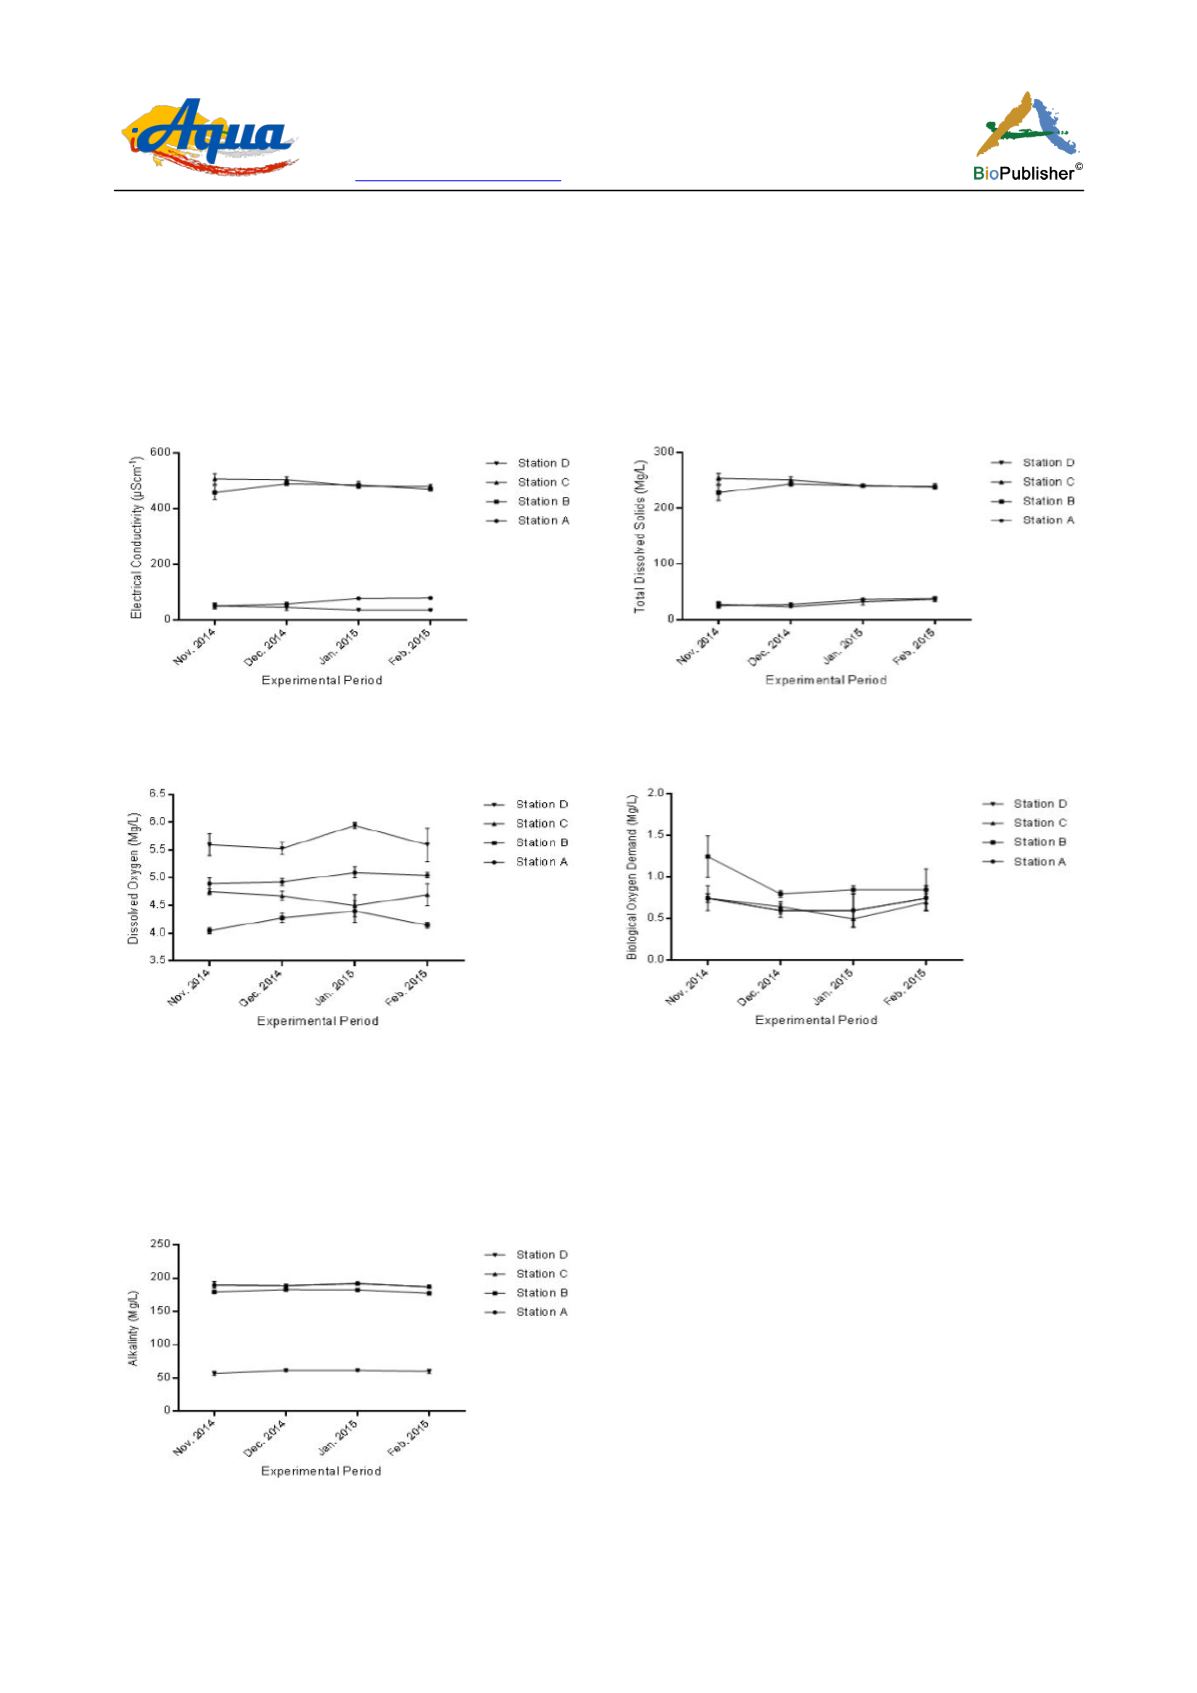
The Biochemical Oxygen Demand was similar in stations B, C and D except in station A which recorded highest
oxygen demand in the month of November, 2015 and the BOD dropped in December and became uniform
throughout the study period (Figure 12). The highest value of Biochemical Oxygen Demand was recorded in
station B (0.91 ± 0.08 mg/l) and the lowest value was recorded in station A (0.63 ± 0.04 mg/l). There was
significant difference (P < 0.05) in Biochemical Oxygen Demand among the stations (Table 3).
Figure 9 Monthly Variation in Electrical Conductivity of River
Benue around WurukumAbattoir
Figure 10 Monthly Variation in Total Dissolved Solids of River
Benue around WurukumAbattoir
Figure 11 Monthly Variation in Dissolved Oxygen of River
Benue around Wurukum Abattoir
Figure 12 Monthly Variation in Biochemical Oxygen Demand
of River Benue around WurukumAbattoir
Alkalinity was low and almost low in stations A and D and was high in station B and C throughout the study
period (Figure 13). Highest value of alkalinity was recorded in station B (180.40 ± 1.40 mg/l) and lowest in
station A (59.10 ±1.16 mg/l) there was significant` difference (P < 0.05) among the stations during the study
period (Table 3).
Figure 13 Monthly Variation in Alkalinity of River Benue around Wurukum Abattoir


