International Journal of Aquaculture, 2016, Vol.6, No.22, 1
-
11
6
Physicochemical Parameters
The mean variation of water quality by station is shown in Table 3. The monthly fluctuations in the physicochemical
parameters are presented in figures 7-13.
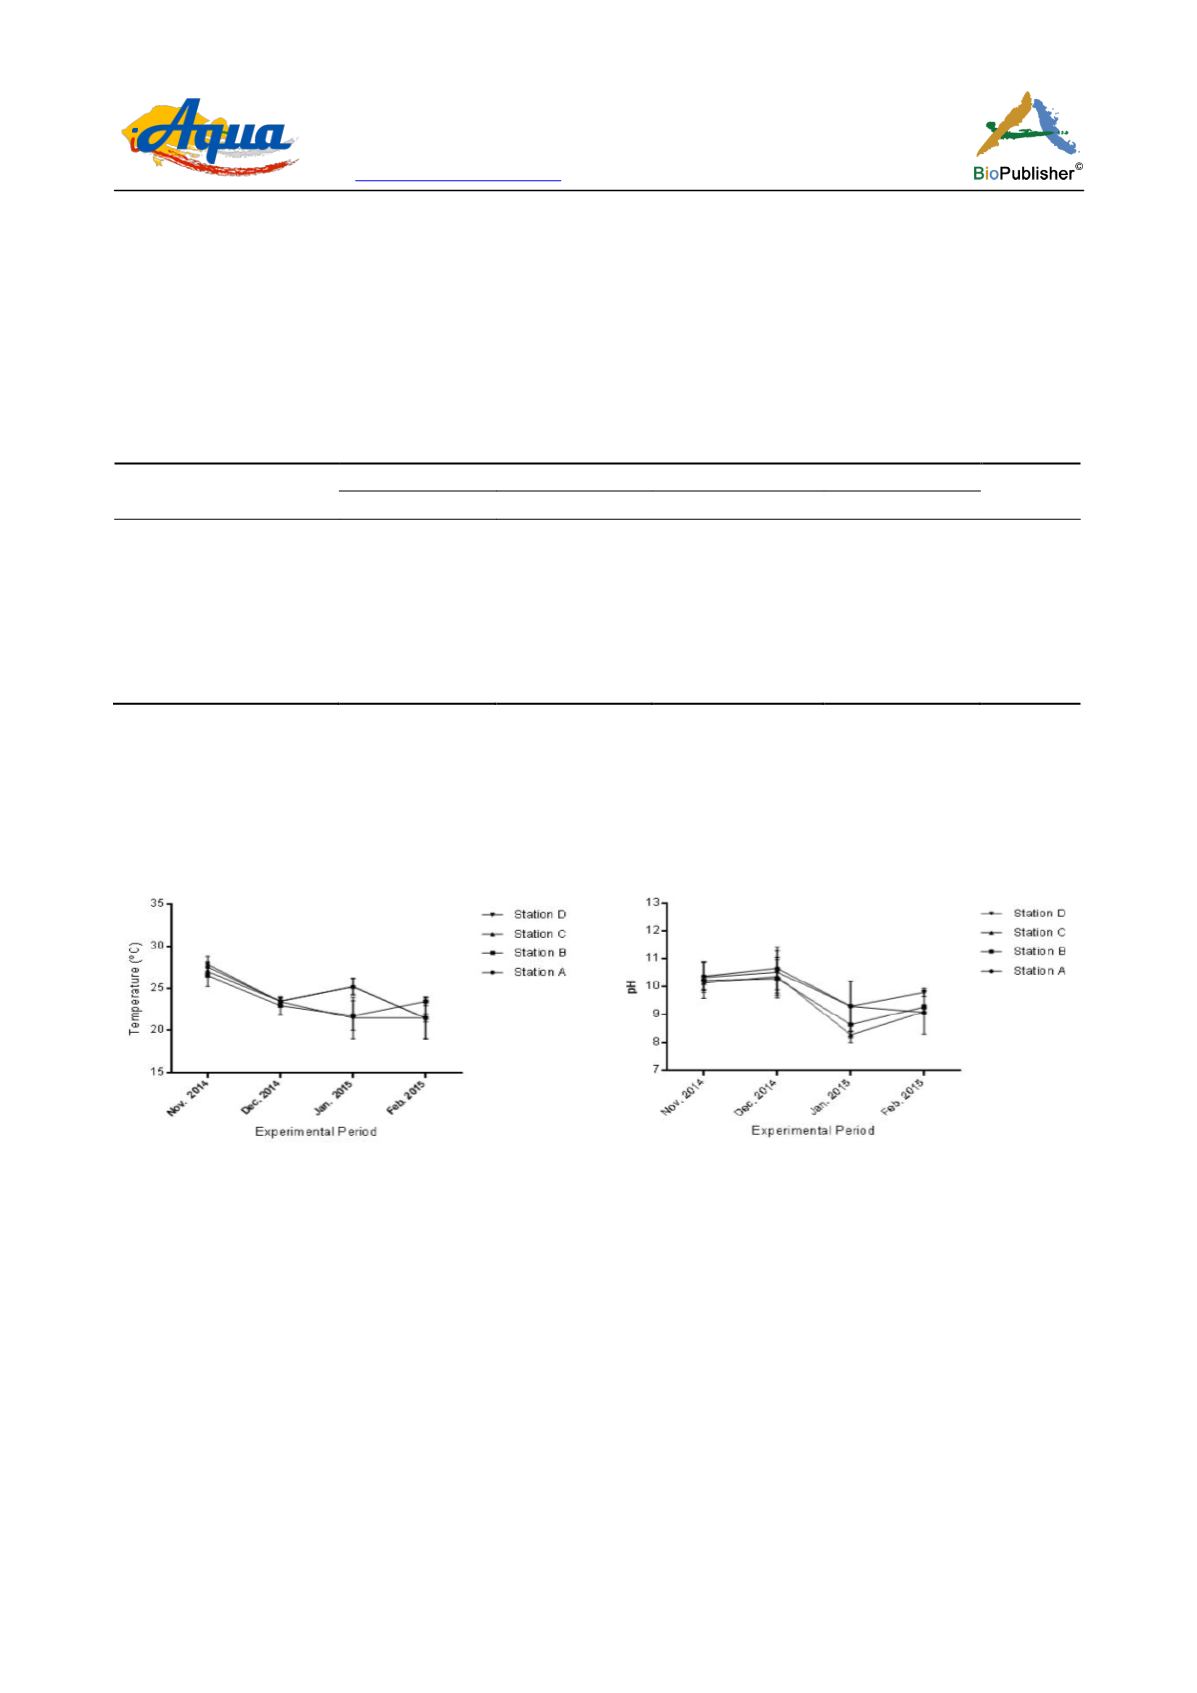
The temperature of river Benue during the study period dropped from November, 2015 to February, 2016 in all the
stations except station B whose temperature rise in December to January but ultimately dropped in February, 2016
(Figure 7). The mean temperature was highest in station A (23.51 ±0.72°C) and was lowest in station B (24.28 ±
0.80°C). There was no significant difference (P > 0.05) among the station throughout the study period.
Table 3 Mean variation of water quality parameters of River Benue around the Wurukum Abattoir
Water Quality Variables
Stations
P-Value
A
B
C
D
Temperature (
o
C)
24.28 ±0.80
23.51 ±0.72
24.17 ±0.75
23.56 ±0.89
0.86
ns
pH
10.02 ±0.41
9.76 ±0.37
9.64 ±0.37
10.11 ±0.36
0.79
ns
EC (µs/cm)
43.40 ±4.67
d
496.50 ±6.38
a
479.10 ±6.59
b
64.30 ±4.51
c
0.00
TDS (Mg/l)
29.20 ±2.11
d
247.70 ±3.17
a
239.70 ±3.22
b
31.30 ±2.11
c
0.00
DO (Mg/l)
5.64 ±0.09
a
4.23 ±0.06
d
4.66 ±0.06
c
4.98 ±0.05
b
0.00
BOD (Mg/l)
0.63 ±0.04
b
0.91 ±0.08
a
0.68 ±0.06
b
0.66 ±0.05
b
0.01
Alkalinity (Mg/l)
59.10 ±1.16
b
189.40 ±1.40
a
189.50 ±1.40
a
60.30 ±1.09
c
0.00
Note: Means on the same row with different superscript are statistically significant (p<0.05), ns = not significant
The pH of river Benue was uniform from, November, 2015 to January, 2016 and rise from January, 2015 to
February, 2016 (Figure 8). Mean value of pH was highest in station D (10.11 ±0.36) and was lowest in station C
(9.64 ± 0.36). There was no significant difference (P > 0.05) among the stations throughout the study period
(Table 3).
Figure 7 Monthly Variation in Temperature of River Benue
around Wurukum Abattoir
Figure 8 Monthly Variation in pH of River Benue around
Wurukum Abattoir
Electrical Conductivity was almost uniform in station A and D and was high in stations B and C across the study
period (Figure 9). The mean Electrical Conductivity was highest in station B (496.5 ±636 µs/cm) and lowest in
station A (43.40 ±4.67 mg/l). There was significant difference (P < 0.05) among the stations during the study
period (Table 3).
The Total Dissolved Solids was low in station A and D and was high in stations B and C throughout the study
period (Figure 10). The mean value of total dissolved solids was highest in station B and (347.70 ±3.17 mg/l) and
was lowest in stations D (31.30 ± 2.11 mg/l). There was significant difference (P < 0.05) among the stations
during the study period (Table 3).
,
The dissolved oxygen was high in station A, D, B, and C in descending order and was almost uniform across the
stations throughout the study period (Figure 11). The mean value of dissolved oxygen was highest in station A


