Basic HTML Version


International Journal of Aquaculture, 2014, Vol.4, No.16 96
-
101
http://ija.biopublisher.ca
99
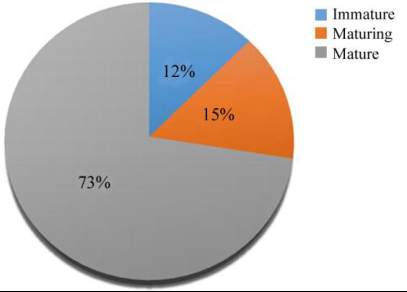
Figure 3 Percentages of maturity stages of
O. niloticus
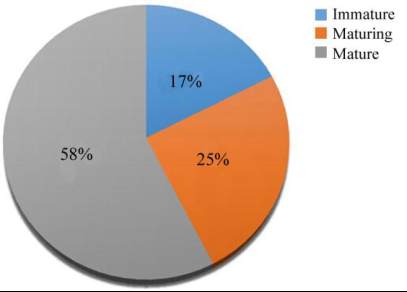
Figure 4 Percentages of maturity stages of
O. tanganicae
which was in agreement with the results reported by
Pena-Mendoza
et al
., (2005), but disagree with
Shalloof and Salama (2008) for
O. niloticus
and Olele
(2010) for
S. galilaeus
. These differences arose
probably because the sexual maturity was a function
of the size and could have been influenced by the
abundance and seasonal availability of food,
temperature, photoperiod and other environmental
factors at different localities (Pena-Mendoza
et al
.,
2005). Seventy-three (73 %) percent of
O. niloticus
had matured and were in the reproductive process
compared to fifty-eight (58 %) percent for
O.
tanganicae
. Maturity peak of both species was
observed in October, which was associated with warm
temperature and onset of the rain season culminating
into a rise in water levels.
The gonadal weight and gonadosomatic index was
calculated by using gonad and body weight
(Gonad/body weight * 100) and the average values for
O. niloticus
was found to be 1.07 and 1.53, while that
for
O. tanganicae
was 0.86 and 1.41 respectively.
Gonadosomatic index is a very important parameter
for understanding gonad development of fish (Begum
et al
., 2008). There was no significant differences
(p>0.05) between gonadosomatic index values of
O.
niloticus
and
tanganicae
. Both growth performance in
terms of somatic and maturation were higher in
O.
niloticus
than in
O. tanganicae
. That could be due to
differences in uptake and utilization of feed between
these species.
The mean water quality parameters during the entire
experimental period are presented in Table 1.
Table 1 Mean value (±SD) of water quality parameters for different months
Months
Water temperature (
℃
)
Dissolved oxygen (mg/L)
pH
August
23.34±0.76
4.92±0.94
7.39±0.06
September
24.56±0.51
5.01±1.03
7.42±0.02
October
25.46±0.82
6.19±1.17
7.50±0.03
Note: Values represent means of three replicates
Tilapias are more tolerant to a wide variety of
environmental conditions and to the extreme
growth and development is affected (Popma and
Lovshin 1995). Water temperature influences the
physico-chemical and biological factors of water body.
Water temperature also has a major influence on the
amount of food consumed by a fish (Jobling, 1998).
When fish are fed to satiation, growth at the preferred
temperature is typically three times greater than at
22
℃
. Maximum feed consumption at 22
℃
is only 50
to 60% as great as at 26
℃
(Popma and Lovshin
1995). Reproduction is also inhibited at water
temperatures below 20
o
C, slowed at waters
temperature of 21 to 24
o
C and most frequent growth
is recorded in waters above 25
o
C. The ranges of
mean values for water temperature in different
months in the present study were: 23.34±0.76 to
25.46±0. These values were more or less similar to
those reported by Paul (1998), Rahman (1999),
Kohinoor (2000) and Kohinoor
et al
., (2004).