Cancer Genetics and Epigenetics 2016, Vol.4, No.2, 1-9
5
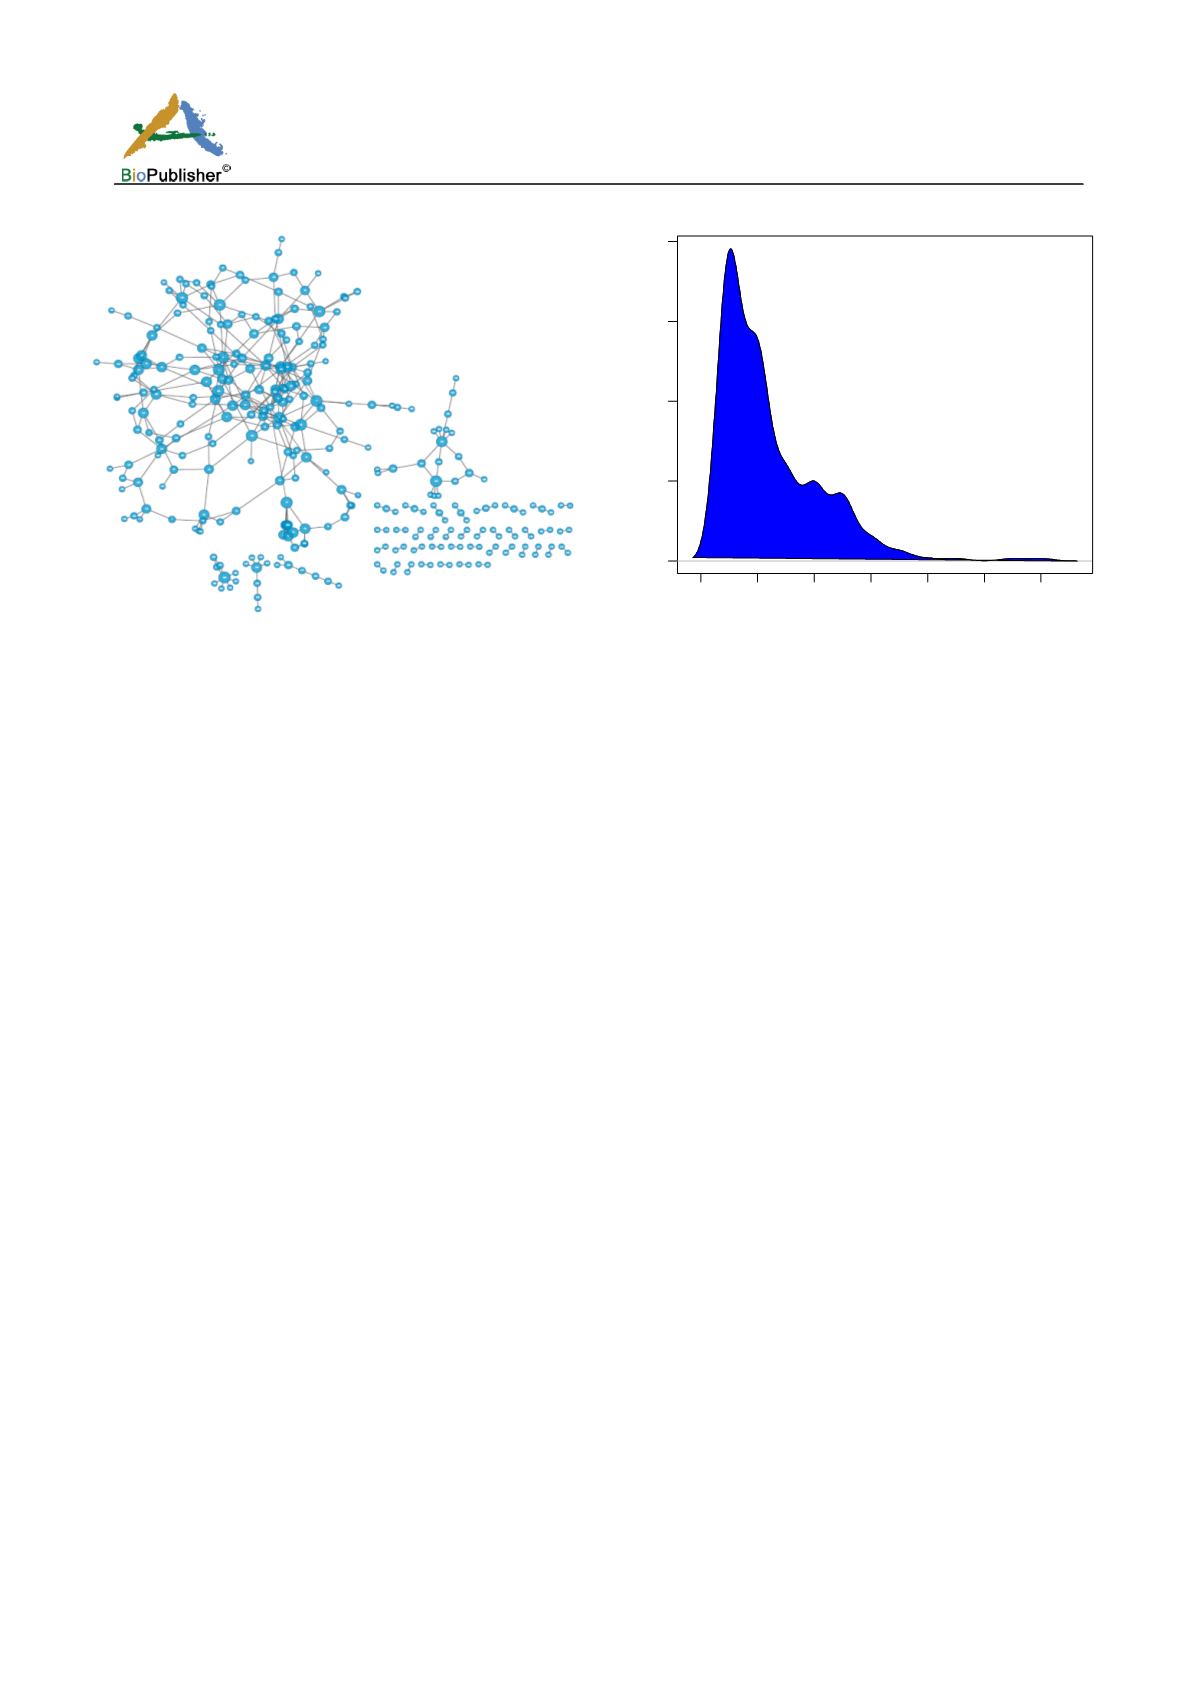
Figure 2 KEGG pathway network
Figure 3 The probability distribution of nodes in the network
Construction and analysis of KEGG pathway network
Eight KEGG pathways which differentially expressed genes enriched were downloaded from KEGG website.
XML R package was used to extract information of gene interactions. These relationships between gene pairs
were integrated and a KEGG network was built. The network consists of 317 nodes, 384 edges (Figure 2).
Degrees of nodes in the graph were represented by different node sizes. Next, the Cytoscape software was
used for network analysis. The diameter of network was 11, the clustering coefficient was 0.016 and the
distribution of node degrees was in line with power-law distribution (Figure 3).
Since the hub nodes in network tend to be more important, because their change may affect more genes which
have interaction with them. Therefore, we selected degree ranked in the top 10% of all the nodes in the
network as the hub node, contain 32 genes, these genes were seen as candidate genes associated with breast
cancer.
Identification of prognosis molecular markers of breast cancer
Then we extracted the gene expression profiles of these candidate genes from the gene expression data.
Finally we got the gene expression information of 23 in 32 genes; there are nine genes were missing in gene
expression data. Next, the clinical information of each breast cancer sample was obtained from TCGA
database, including the survival time and status, age, and stage information. Then Cox proportional hazards
regression model was used to detect the association between genes and survival, adjusting for age and stage.
In these 23 genes, there are three (AARS, ADK, ADORA2A) were significantly associated with prognosis of
breast cancer (p < 0.05, Table 1).
Then these three potential candidate genes for breast cancer prognostic marker were introduced in to the
multivariate analysis, by Cox regression coefficient of the three genes and their expression values in each
sample we obtained the risk score of each sample. According to the risk score samples were divided into a
high risk group and a low risk group. The threshold for grouping was the median of risk scores. Then the
Kaplan Meier method was used for survival analysis of these two groups, and draws their survival curve. The
significant of difference between them was tested by logrank method and the result showed that the survival
difference between these two groups was significant (p = 2.95e-05, Figure 4). The red curve represented the
high risk group; and green curve is the low risk group. This indicated that these three genes can be used as
prognostic marker for breast cancer and their further verification test is necessary.
0
2
4
6
8 10 12
0.0
0.1
0.2
0.3
0.4
degree of node
Density


