Molecular Plant Breeding 2015, Vol.6, No.16, 1
-
13
6
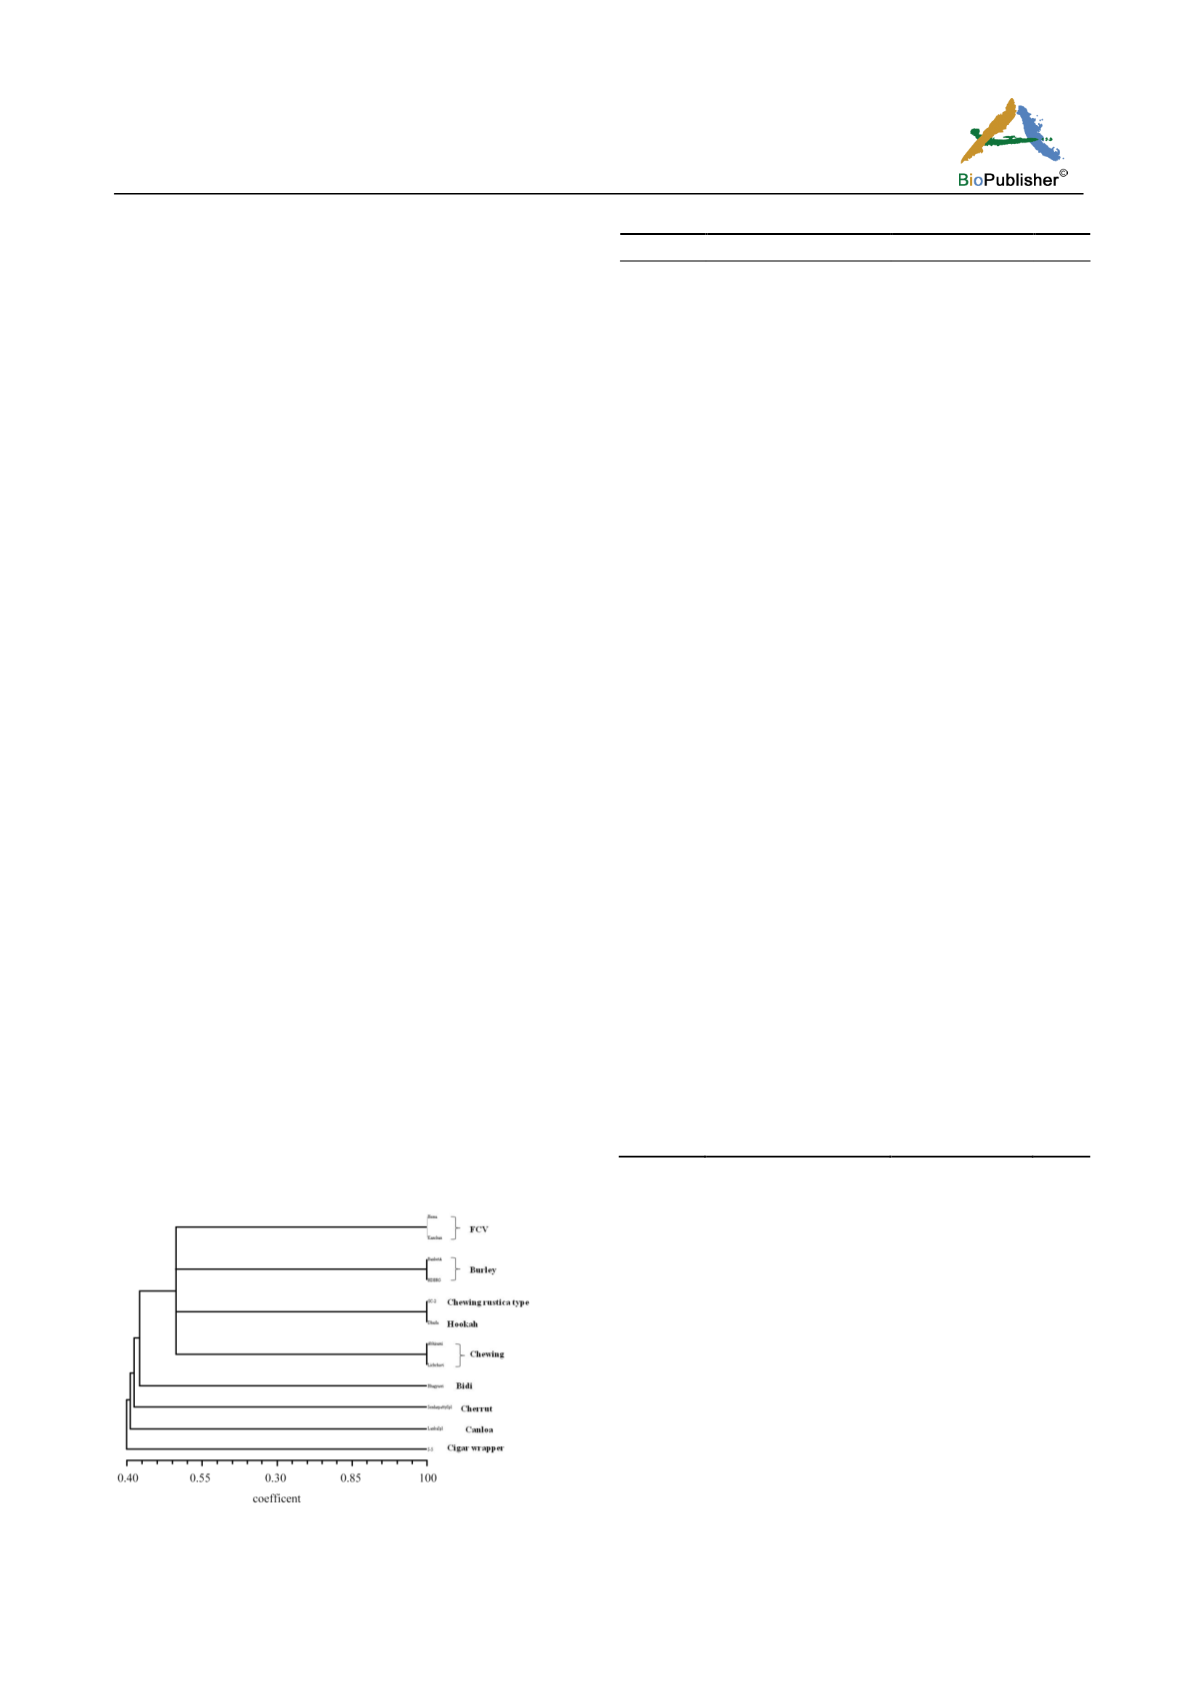
cluster (Figure 2). The genetic diversity analysis of 12
accessions from eight types of cultivated tobacco
using 35 microsatellite markers revealed that all
markers were polymorphic exhibiting an average
polymorphic information content (PIC) of 0.55 (range
0.15-0.99) (Table 3). A total of 260 alleles were
produced by these loci with an average of 7.4 alleles
per marker in the size range of 150 to 500 bp. Among
these markers, TbM28 had the highest PIC value of
0.99 followed by TbM9, TbM10, TbM14, TbM16 and
TbM30 (0.97). It was observed that the mean PIC
value was higher for markers developed by targeting
perfect repeats (0.57), while it was lower for markers
targeting imperfect repeats (0.19). The markers with
higher PIC values will be useful for diversity analysis,
varietal identification, mapping of traits, etc. The type
specific markers identified in the present study would
be useful in testing of purity of different types of
tobaccos (Table 4).
2.4 Understanding the diversity among the genus
Nicotiana
A total of 455 alleles were obtained from 70 markers
using 24
Nicotiana
spp. with an average of 6.4 alleles
per locus (Table 2). A maximum of nine alleles was
detected for four markers (TbM46, TbM52, TbM56
and TbM59) while a minimum of four alleles was
detected for TbM4 with the allele size ranging from
150 to 700 bp.
All the 70 markers were showed high observed
heterozygosity (H
o
) than expected heterozygosity (H
e
).
The expected heterozygosity ranged from 0 to 0.38
(mean 0.18) while the observed heterozygosity ranged
from 0 to 0.50 (mean 0.43) (Table 2). The markers
Figure 2 Characterization of different types of tobacco using
SSR markers.
Table 3 Characteristics of the SSRs among tobacco genotypes
Locus
Allele size range (bp)
No. of alleles
PIC
TbM1
150-200
5
0.94
TbM2
150-200
5
0.94
TbM3
150-200
5
0.15
TbM4
150-200
5
0.15
TbM5
150-200
5
0.15
TbM6
200-250
5
0.94
TbM7
150-200
5
0.15
TbM8
150-200
5
0.94
TbM9
150-200
6
0.97
TbM10
150-200
6
0.97
TbM11
150-200
6
0.15
TbM12
200-250
6
0.15
TbM13
150-200
6
0.15
TbM14
150-200
6
0.97
TbM15
150-200
6
0.15
TbM16
150-200
6
0.97
TbM17
150-200
6
0.94
TbM18
250-300
8
0.94
TbM19
150-200
8
0.15
TbM20
150-200
8
0.15
TbM21
200-250
8
0.15
TbM22
150-200
8
0.94
TbM23
150-200
8
0.15
TbM24
150-200
8
0.94
TbM25
200-250
8
0.28
TbM26
150-200
8
0.28
TbM27
250-300
8
0.15
TbM28
150-200
6
0.99
TbM29
150-200
6
0.15
TbM30
150-200
6
0.97
TbM31
150-200
6
0.15
TbM32
150-200
6
0.94
TbM33
150-200
6
0.94
TbM34
150-200
6
0.94
TbM35
200-250
6
0.15
PIC-polymorphism information content
developed from both perfect and imperfect SSR
motifs exhibited slight difference in H
e
(mean 0.19)
and H
o
(0.16) values. Similarly, the mean value of H
o
for di and trinucleotide repeats were also showed less
variation, while the H
e
values for di nucleotides (0.18)
were slightly lesser than trinucleotides (0.21). The
estimated frequency of null alleles was not zero for 19
of the 70 loci. The probabilities of identity ranged
from 0.13 to 0.44 with a mean value of 0.13.
The genetic diversity analysis among the genus
Nicotiana
using Unweighted Pair Group Method on
Arithmetic averages (UPGMA) method of clustering


