International Journal of Aquaculture, 2015, Vol.5, No.27 1
-
10
6
Populations
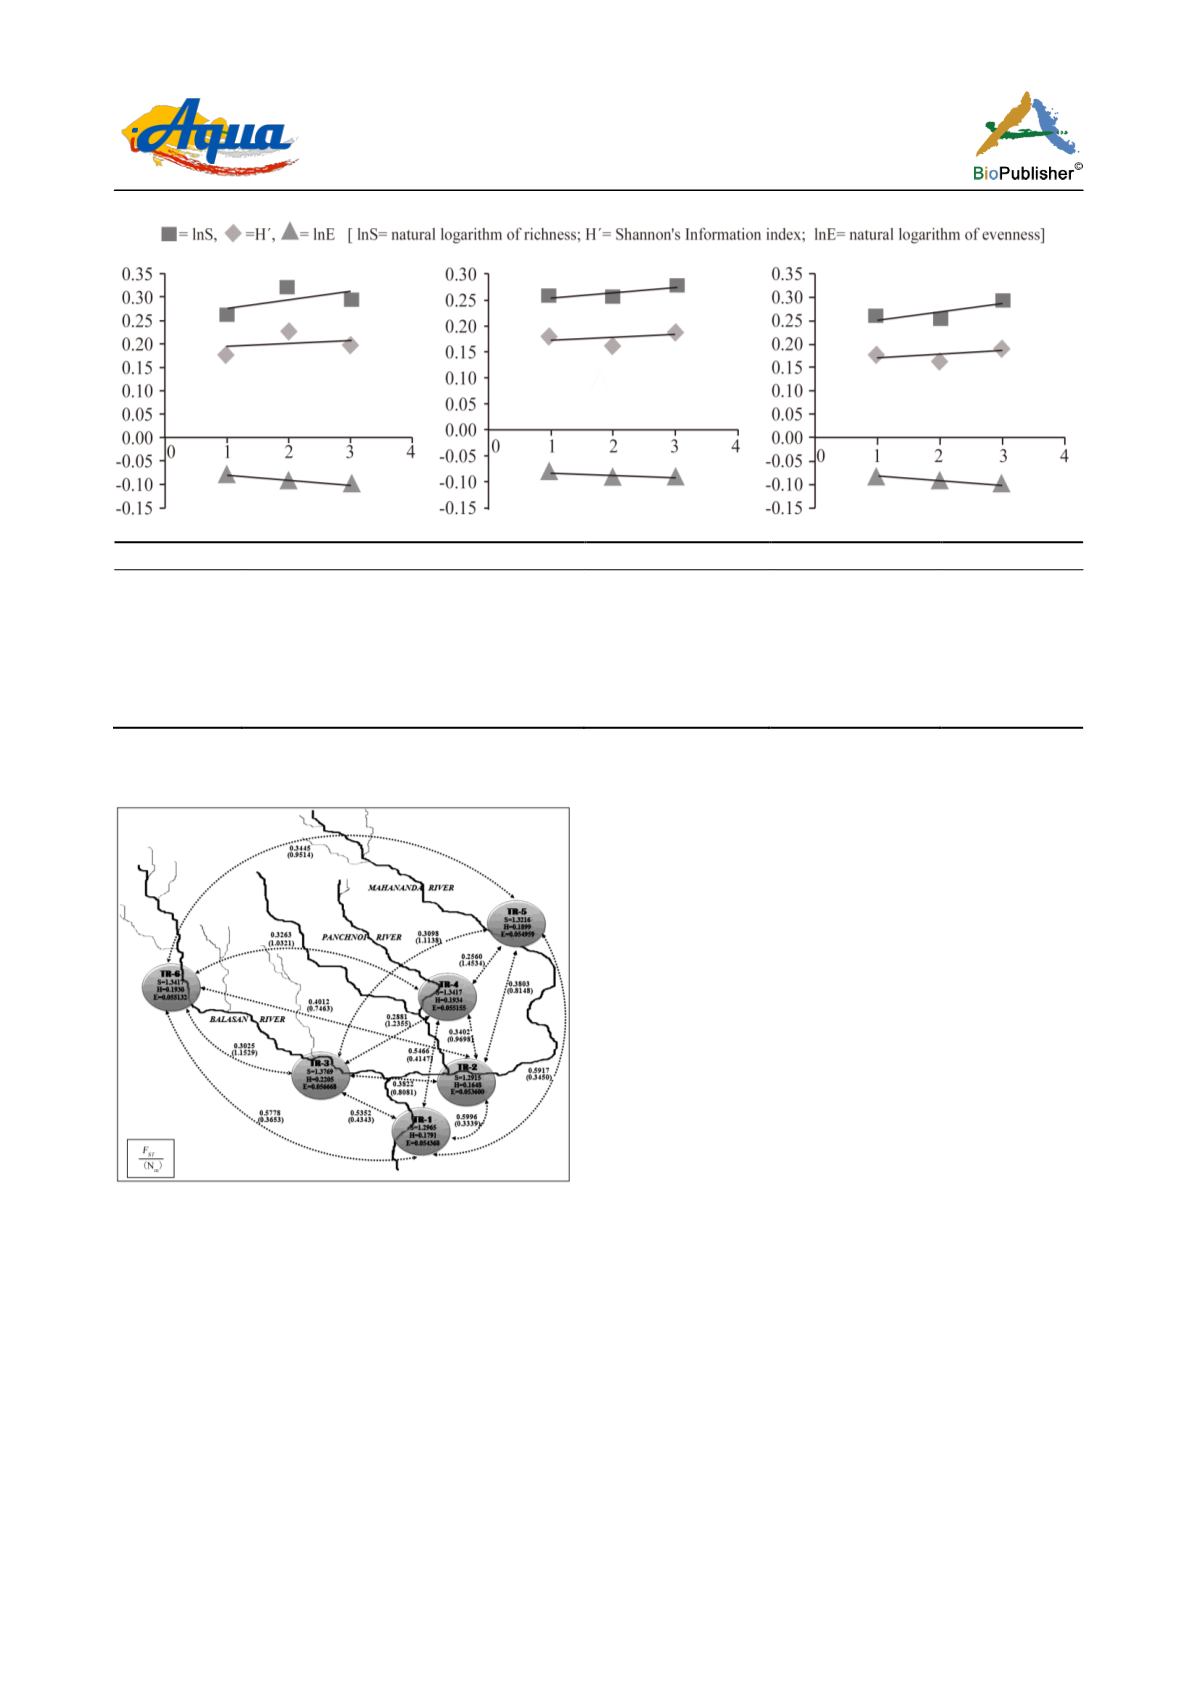
lnS
H´
lnE
TR-1
Mahananda Barrage at Fulbari
0.259668
0.1791
-0.0806
TR-2
Mahananda - Panchnoi River Junction
0.255804
0.1648
-0.09097
TR-3
Balasan River at Palpara
0.319835
0.2205
-0.09933
TR-4
Panchnoi River
0.293937
0.1934
-0.10051
TR-5
Mahananda River at Champasari
0.278843
0.1899
-0.08897
TR-6
Balasan River at Tarabari
0.293937
0.1930
-0.10092
Figure 5
SHE
analysis plots showing expected patterns of diversity
Figure 6 Genetic hierarchical model of six different populations
of
Badis badis
. The dotted arrows indicate the gene
differentiation (
F
ST
) and gene flow (
N
m
) (within parentheses)
(see inner box). The shaded circles indicate the collection sites;
S= richness; H= Shannon Information index (
H´
); E= measure
of evenness. Major streams are marked in dark lines and minor
streams are indicated in faded lines
along a gradient and also look for the breaks in the
pattern that indicate the change in diversity of the
population (Buzas and Hayek, 1998). Hayek and
Buzas (1997)
pointed out that often the diversity (
H´
)
changes because the differences between richness (
S
)
and evenness (
E
) do not offset each other (i.e.,
H´
1
≠
H´
2
,
S
1
≠ S
2
,
E
1
≠ E
2
, where 1 and 2 in suffix are any
two population) and such
SHE
plot is log normal one.
SHE
analysis appears to be a useful approach for
defining the diversity; moreover, it allows a high
resolution visualization of the changes in diversity in a
temporal as well as spatial scale. Our data revealed
that as the river streams converged from higher to
lower altitude, the diversity and richness of the
Badis
badis
populations decreased and evenness increased
(Figure 5, Plots A, B and C). This decrease in
diversity and richness within the gene pool of the
Badis
population may be due to flow pattern
disturbances and human interferences (such as fishing
and pesticide run-offs from adjacent tea gardens in the
hilly areas of lower Himalayas) as the river streams
flow from higher to lower altitudes. All of these
causes can culminate in to the observed decline and
change in diversity pattern and richness in
Badis
badis
populations across the river stream along the
altitudinal gradient.
Fixation index or
F
ST
is a measure of genetic
divergence among subpopulations that ranges from 0
(when all subpopulations have equal allele frequencies)
to 1 (when all the subpopulations are fixed for
different alleles) (Allendorf et al., 2013)
.
We found
that the
F
ST
value highest between the TR-1 and TR-2
population and consequently lowest gene flow


