International Journal of Aquaculture, 2015, Vol.5, No.27 1
-
10
5
A
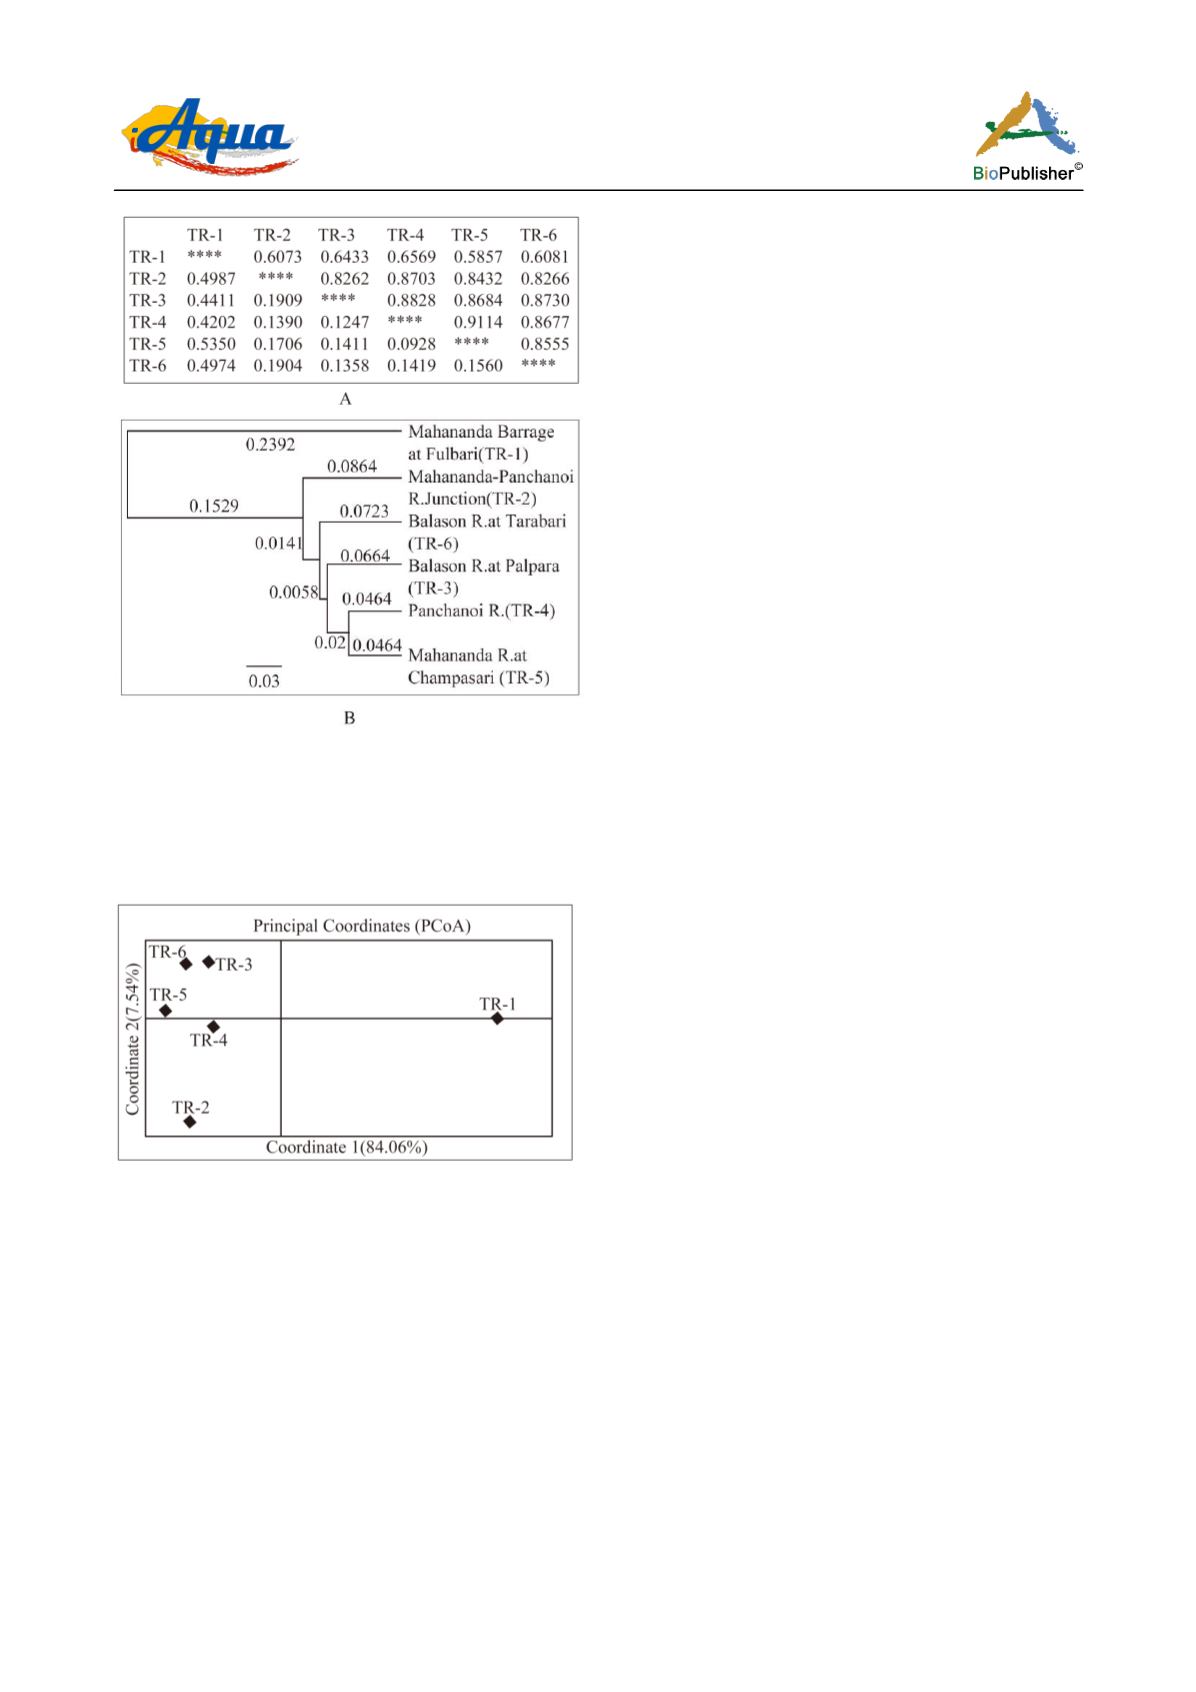
Figure 3 A Matrix showing values of Nei's (1978) unbiased
measures of genetic similarity (above diagonal) and genetic
distance (below diagonal). B UPGMA dendrogram based on
Nei’s (1978) unbiased genetic distance matrix. The numbers
above the branches denote the branch lengths
Figure 4 Principal Coordinate Analysis indicates spatial genetic
structure of six
Badis badis
populations based on a population
genetic distance matrix (Nei 1978) with data standardization.
Coordinates 1 and 2 explain 84.06 % and 7.54 % of the
variations respectively
different riverine populations of the Terai
regions.We found that the
lnS
and
H´
were highest
in TR-3 (0.319835 and 0.2205) and lowest in TR-2
population (0.255804 and 0.1648 respectively) (Figure
5 lower panel). The
lnE
value was highest in TR-1
population (-0.8060) and lowest in TR-6 population
(0.10092) (Figure 5 lower panel). The
SHE
analysis plot
revealed the observed pattern for distribution of three
components viz.,
S
(richness),
H´
(Shannon's Information
index) and
E
(evenness) in relation to six different
populations. We divided the six riverine populations in
three groups [TR-1, TR-3, TR-6 constituting first
group (Plot A); TR-1, TR-2, TR-5 constituting second
group (Plot B); TR-1, TR-2, TR-4 constituting third
group (Plot C)] based on the continuity of the water
flow through the river stream (Figure 5). Since water
flows from higher to lower altitude there is an
expected trend of increase in
S
(richness) and
H´
(Shannon's Information index) but decrease in
E
(evenness) in all the three analyses as one goes
upstream (Figure 5 upper panel).
2 Discussions
RAPD technique has been widely used to ascertain the
available gene pool of different subdivided
populations of a species that may have arisen either by
means of selection pressure or as a result of genetic
drift (Fuchs et al., 1998). The ornamental fish
Badis
badis
has been considered to be a vulnerable fish
species in the Indian scenario demanding conservation,
management and stock enhancement in the Terai
region of West Bengal, India. The region is within a
biodiversity hotspot; therefore, acquiring information
regarding the population genetic structure of this
species might be helpful to the development of
suitable conservation strategies. To our knowledge,
the present study is the first attempt to explore and
also to investigate the present status population-
specific genetic relationship of this species, changes in
the diversity pattern and also map the genetic
hierarchy in this sub-Himalayan hotspot region of
northern West Bengal, India.
Since Shannon’s index of diversity can be decomposed
into two metric components namely species richness
(
E
) and evenness (
S
) i.e., (
H´= lnE+ lnS
) (Buzas and
Hayek, 1996) sometimes it is difficult to interpret
whether the diversity index is influenced by
greater/lower richness or greater/lower evenness
values or both. However, this decomposition also
allows us to analyze the change in diversity pattern
though different subpopulations. We have found that
the diversity (
H´
), richness (
S
) and evenness (
E
) have
varied across all six populations (
Figure
5 and 6)
which are most obvious in naturally subdivided
populations. Therefore the
SHE
analysis can deduce
the change in the diversity pattern of populations


