Cancer Genetics and Epigenetics 2015, Vol.3, No.11, 1-8
4
Pathway enrichment analysis is to find metabolic
pathways for the differentially methylated genes.
Screened differentially methylated genes were used to
do functional enrichment analysis and pathway
enrichment analysis by DAVID software.
2 Results
2.1 DNA methylation data processing results
42 samples with
DNMT3A
(excluding
IDH
mutations),
19 samples with
IDH
(excluding
DNMT3A
mutation),
13 samples with
IDH_3AD
JHU-USC Human-
Methylation450K data were used to draw DNA
methylation cluster heat map of all disease samples
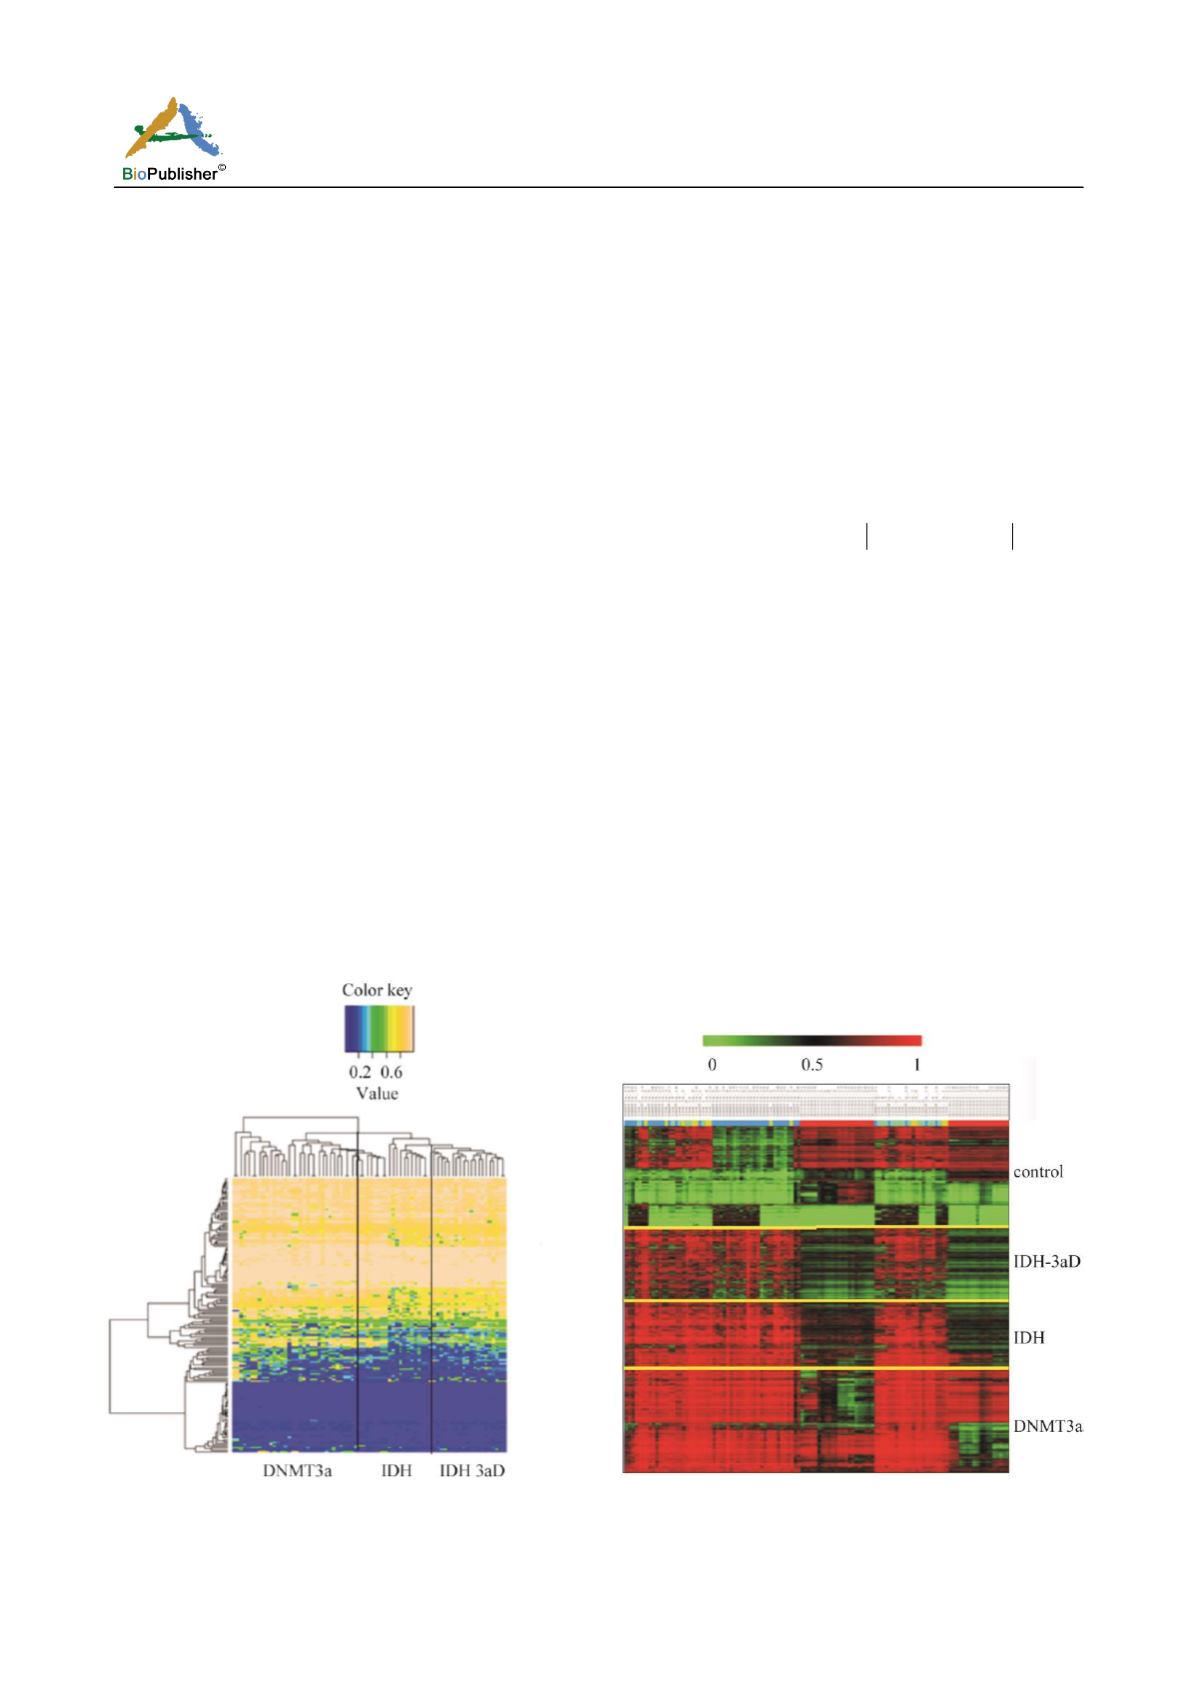
(Figure 1).The row represents sample and the column
represents CpG sites. As can be seen from Figure 1,
DNA methylation level among the different samples
exists difference, thus demonstrating acute myeloid
leukemia may relate to DNA methylation. We can dig
out the DNA methylation characteristics associated
with acute myeloid leukemia to classify patients.
We use JHU-USC HumanMethylation450K data
downloaded from TCGA (
),
each sample has 485,577 CpG sites, each site
corresponds to a methylation value. Firstly, in order to
remove the influence of the differences among
samples, we screen DMS among the same mutation
samples by QDMR method (SD=0.15).The results are
as follows(Table 1):
Figure 1 DNA methylation cluster heatmap of all disease
samples(x-axis represents the type of mutation, y-axis
represents probe)
As can be seen from Table 1,compared with disease
samples, there is little internal individual variation in
40 normal blood samples. Then we intersected
stability CpG sites of the four types of samples to
obtain 303,019 CpG sites. We screened DMS between
three mutation samples and normal samples using
QDMR method(SD=0.07).The results are as
follows(Table 2):
Then we union DMS of Table 2 and obtain 105,229
CpG sites. We use these CpG sites to screen
DMS(using SAMR package
15.0
value
difference
,
and
1
qvalue
).Finally we obtain 1,991 DMS and
they correspond to 1,452 genes. we use 1,452 genes to
do clustering analysis. we use a hierarchical clustering
method to connect the average distance matrix and use
the Pearson correlation coefficient matrix to obtain the
clustering heat map (Figure 2).The row represents
genes and the column represents samples, samples
from top to bottom as normal samples,
IDH_3AD
mutation samples,
IDH
mutation samples,
DNMT3A
mutation samples.
As can be seen from Figure 2, DNA methylation levels
can really separate the different types of sample well,
compared with normal samples, mutation samples have a
clear ultrahigh methylation level. Furthermore, most DNA
methylation value of disease samples exceeded 0.5.
Figure 2 Clustering heat map of disease samples and normal
samples(x-axis represents probe, y-axis represents the type of
mutation)


