Cancer Genetics and Epigenetics 2015, Vol.3, No.11, 1-8
6
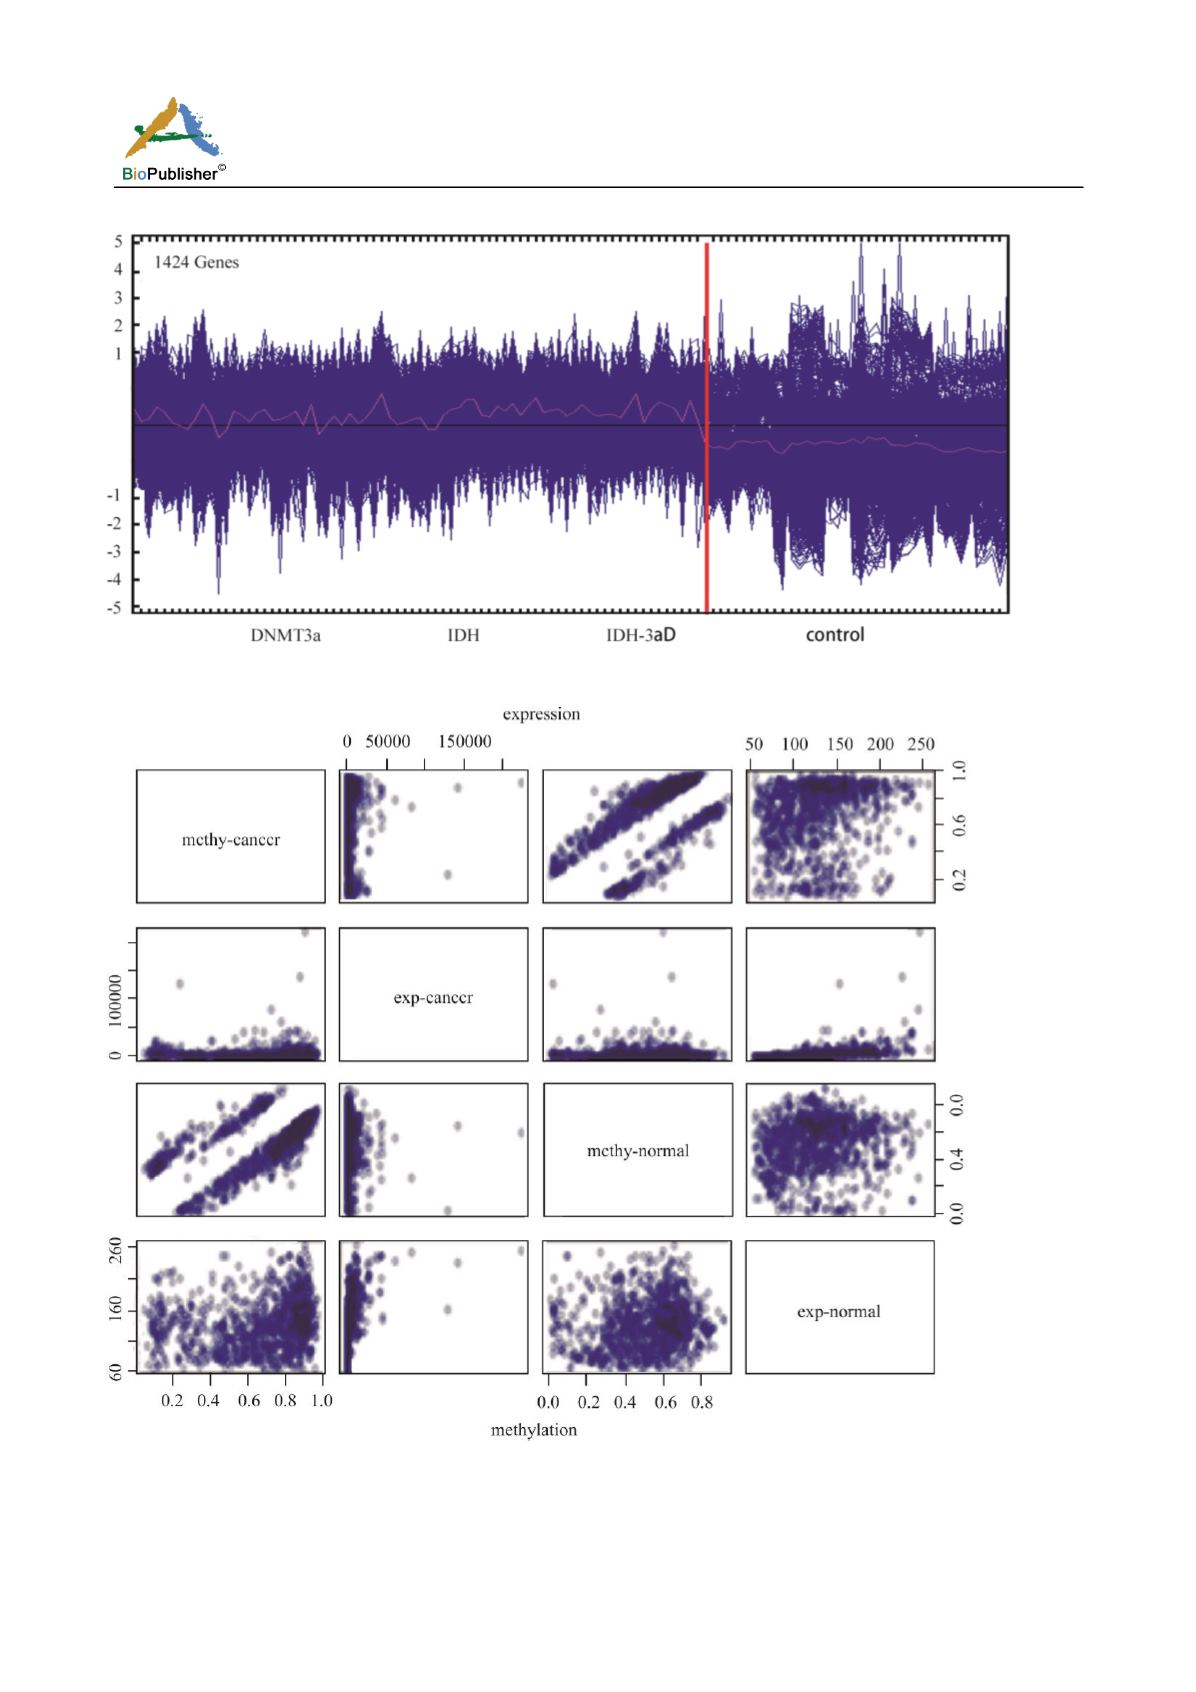
Figure 3 T test chart(x-axis represents the type of mutation, y-axis represents T test value)
Figure 4 The correlation graph between DNA methylation and gene expression in the gene body (just look at two small map: The
first line of the second column shows the relationship between DNA methylation and gene expression in cancer, The first line of the
fourth column shows the relationship between DNA methylation and expression in normal samples)


