Basic HTML Version


GC2 Biology Dictates Gene Expressivity in
Camellia sinensis
20
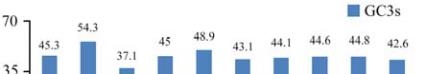
indicating that there is a wide variation of codon
usage bias among the genes. The variation of codon
usage biases among the genes is further confirmed
from the distributions of (G+C) at the third
synonymous codon positions, shown in Figure 2.
These results indicate that apart from compositional
constraints, other trends might influence the overall
codon usage variation among the genes in
Camellia
sinensis
.
Figure 1 Nc distribution of
Camellia sinensis
genes
Figure 2 GC3s distribution of
Camellia sinensis
genes
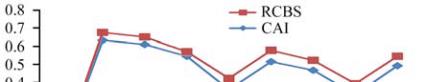
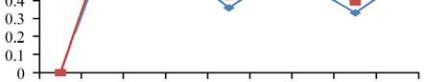
1.3 Relationship between RCBS and CAI values
Each gene has evolved a codon usage pattern
accommodating gene expression level, and RCBS
value >0.5 and CAI value >0.5 exhibits favorable
codon usage. So, we chose these two indices as
effective expression measures based on literary
evidence. The expression level of genes has shown
both CAI and RCBS. From our analysis we have
found that six genes out of ten have RCBS and CAI
values each greater than 0.5, suggesting that these six
genes of
Camellia sinensis
could qualify as highly
expressed genes.
The RCBS and CAI showed similar pattern when we
plotted them on the graph (Figure 3). We analyzed
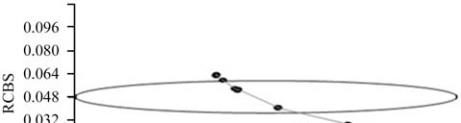
further the relationship between the length of the
coding region and the expression level of genes. In
agreement with previous other studies (Ikemura, 1981;
Ikemura, 1982; Moriyama and Powell, 1998), our data
support the smaller size of highly expressed genes. We
observed that RCBS decreases with the length of the
encoded proteins. A significant negative correlation was
observed between RCBS and protein length. In Figure
4 we plotted RCBS as a function of the gene length.
Figure 3 The relationship between RCBS and CAI values
Figure 4 Relationship between RCBS and protein length
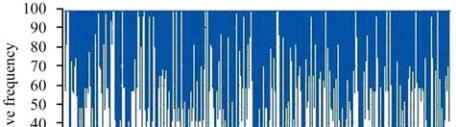
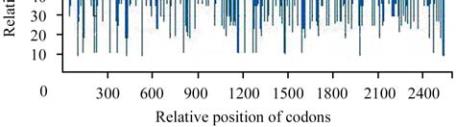
Figure 5 The distribution of codon usage frequency along the
length of the CDS for the gene AMP deaminese
The ideal percentage range of GC content is between
30% to 70% (Figure 5 and Figure 6). Any peak
outside this range adversely affects transcriptional and
translational efficiency. Out of ten genes it was found
that the gene Polyphenol oxidase (PPO) has GC
content outside of the ideal range of 32% to 75%.
These results suggest that the GC content present in the
CDS sequence of the gene affects the expressiveness of
that particular gene. The differences in GC content
Computational
Molecular Biology