Basic HTML Version


Computational Molecular Biology
21
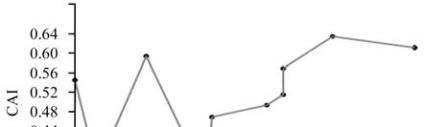
among the genes were again confirmed by plotting CAI
value against the GC content and it was found that two
genes showed negative correlation with gene
expressiveness due to their GC content (Figure 7).
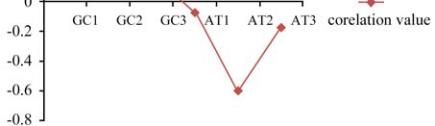
1.4 Relationship between GC and AT content and
the expression patterns of genes
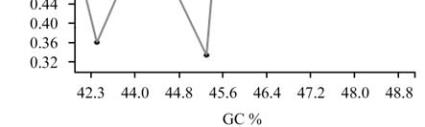
We analyzed normalized AT and GC frequency at each
codon site. We observed that correlations between
gene expression as measured by CAI and GC content
at any codon site are very weak (rGC1=0.069,
rGC2=0.604 and rGC3=0.186) (Figure 8). Thus, in
contradiction with others GC content at the third
codon position comes out to be a very poor predictor
of gene expression in
Camellia sinensis
(Sharp and
Lloyad, 1993; Gerton et al., 2000; Marin et al., 2003).
But at the second codon position the GC content
shows moderate positive correlation with gene
expression. Since the coding sequences of
Camellia
sinensis
are rich in AT, we also analyzed the AT
frequency at each codon site and it was found that the
second codon position showed a moderate negative
correlation with gene expression.
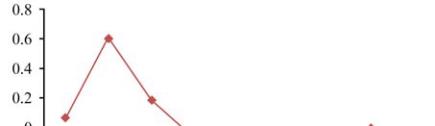
Figure 6 The percentage range of GC content for the Stearoyl
acyl carrier protein desaturase gene
Figure 7 CAI plotted against the GC content for
Camellia
sinensis
genes
Figure 8 Correlation between CAI and GC/AT content at
different codon positions
2 Discussion
In brief, we have presented an expression measure of a
gene, devised to predict the level of gene expression
from relative codon bias and codon adaptation index.
Based on the hypothesis that gene expressivity and
codon composition are strongly correlated, the codon
adaptation index has been defined to provide an
intuitively meaningful measure of the extent of the
codon preference in a gene. We have outlined a simple
approach to assess the strength of codon bias index
in genes as a guide to their likely expression level
and illustrate this with an analysis of
Camellia
sinensis
genes.
The present study was carried out with the objectives:
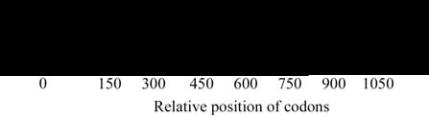
(a) To analyze the CAI, RCBS, GC skew, GC content,
Relative position of codon for the genes of
Camellia
sinensis
. (b) To correlate above mentioned parameters
with the gene expression pattern. As per our
mentioned objectives in this present study, we selected
ten genes from
Camellia sinensis
for CUB analysis.
The accurate coding sequences having correct initial
and termination codons were retrieved using a
program in perl, developed by us. To minimize
sampling errors we have taken only those coding
sequences which are greater than or equal to 1000 bp.
All the above-mentioned parameters for CUB analysis
were calculated by using a PERL-based program
developed by us.
After analyzing the coding sequences for
Camellia
sinensis
it was found that genes are rich in AT. But in
the case of
P. aeruginosa
it is evident that codons
ending in G and/or C are predominant in the entire
Computational
Molecular Biology