Triticeae Genomics and Genetics 2016, Vol.7, No.3, 1
-
9
4
1.3 Sodium
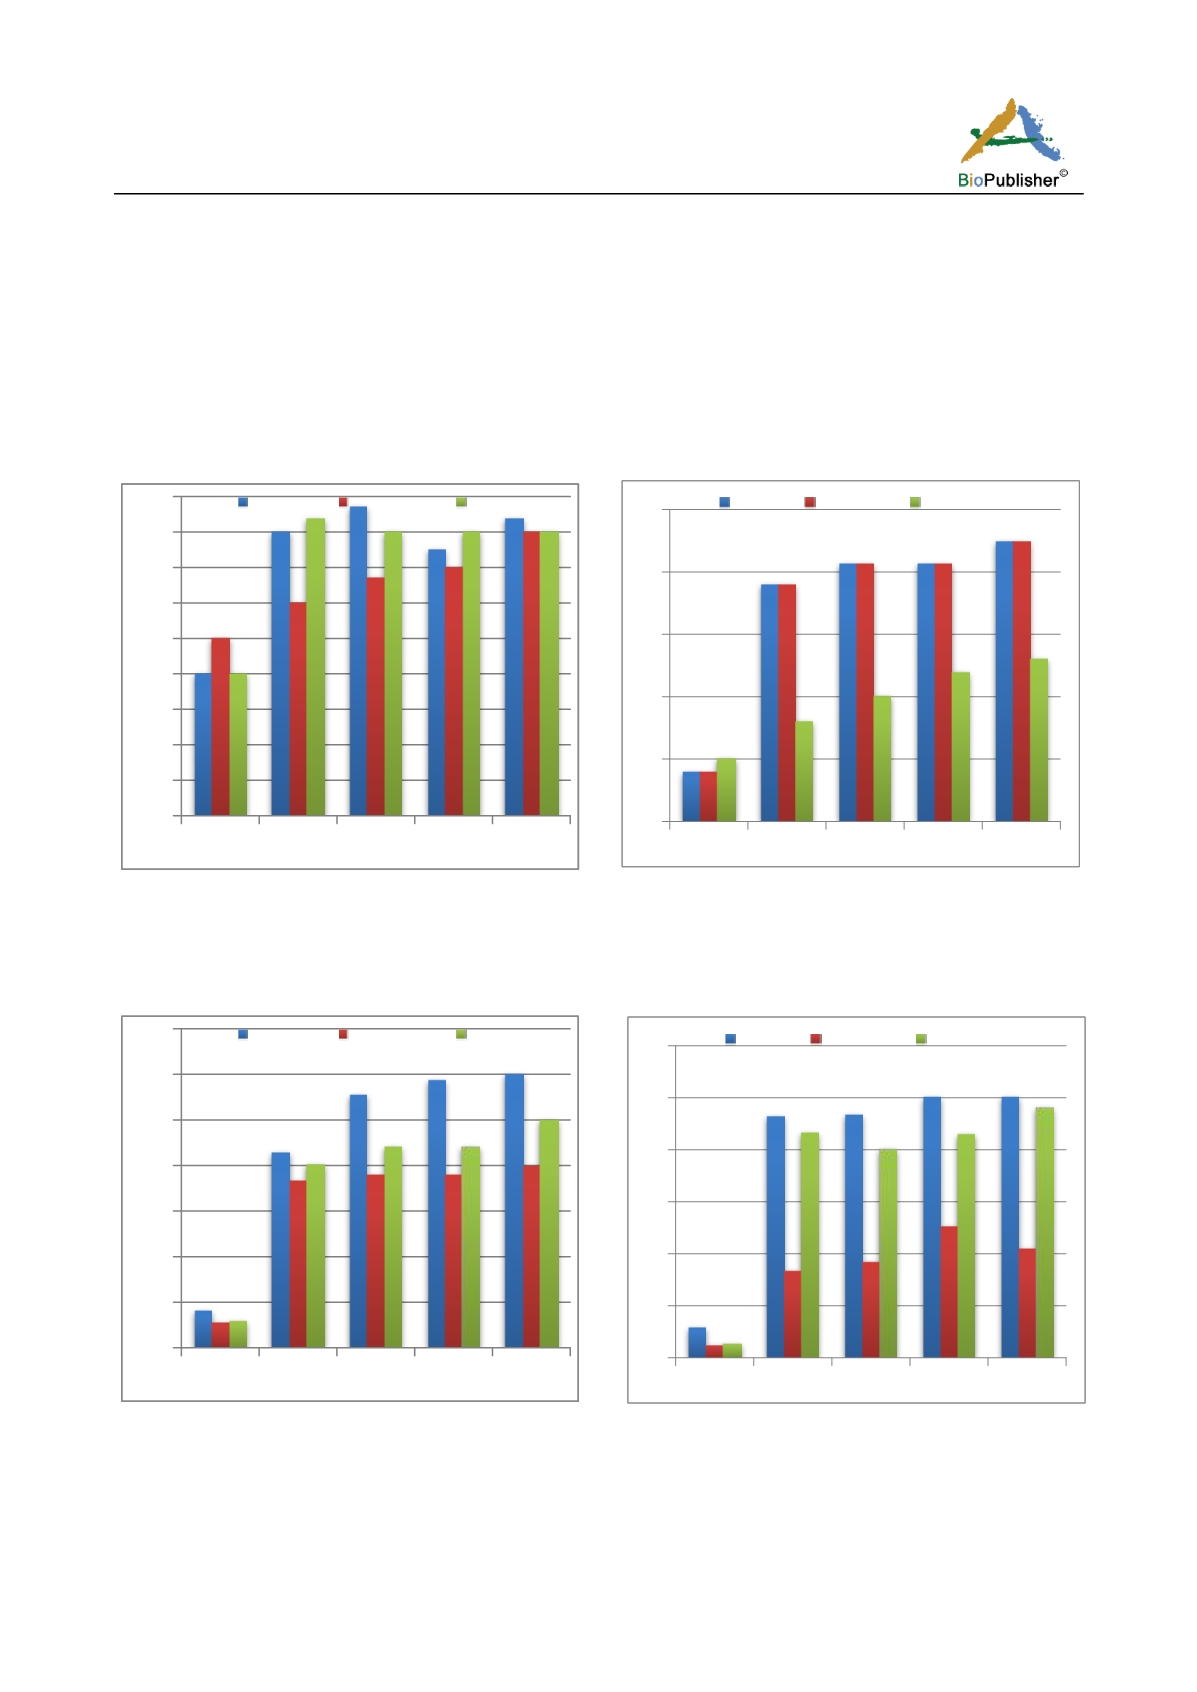
There is an interval increase between the five tested plants in sodium content of shoots and roots (Figure 1; Figure
2; Figure 3; Figure 4; Figure 5). The increase values in sodium content at -1.2 MPa NaCl level reach 26 - folds,
and 21.5- folds, 20- folds, 25- folds, 22- folds, 8- folds, 49- folds, 30- folds, 49- folds and 14.5- folds of shoots
and roots of maize, wheat, cotton, broad bean and parsley plants respectively. The higher values of increase in
sodium content were represented in shoots of parsley and broad bean plant. The opposite situation, the lower
values of increase was represented in shoots of wheat plants. The higher increase values in sodium content were
represented in the roots of broad bean plant. The lower increase values were represented in the roots of cotton
plants.
0
1
2
3
4
5
6
7
8
9
0 0.3 Mpa 0.6 Mpa 0.9 Mpa 1.2 Mpa
Control
Na Cl+GA3
NaC +Kine.
(a) (b)
Figure 3 Effect of salinization and treatment with GA3 or kinetin on Na+ content (mg/g.d.m.) in shoots (a) and roots (b) of cotton
plants grown for 45 days
Note: (a) L.S.D. 0.05% 1.5; (b) L.S.D. 0.05% 1.9
0
5
10
15
20
25
30
35
0 0.3 Mpa 0.6 Mpa 0.9 Mpa 1.2 Mpa
Control
Na Cl+GA3
NaC +Kine.
(a)
(b)
Figure 4 Effect of salinization and treatment with GA3 or kinetin on Na+ content (mg/g.d.m.) in shoots (a) and roots (b) of broad
bean plants grown for 45 days
Note: (a) L.S.D. 0.05% 3.2; (b) L.S.D. 0.05% 2.4
1.4 Phytohormones
0
5
10
15
20
25
0 0.3 Mpa 0.6 Mpa 0.9 Mpa 1.2 Mpa
Control
Na Cl+GA3 NaC +Kine.
0
10
20
30
40
50
60
0 0.3 Mpa 0.6 Mpa 0.9 Mpa 1.2 Mpa
Control
Na Cl+GA3 NaC +Kine.


