Triticeae Genomics and Genetics 2016, Vol.7, No.02, 1
-
16
7
In roots cv. Giza 168the soluble protein in root
remained more or less unchanged up to 150 mMNaCl,
and then some activation was recorded about 14.3% at
levels from 150 mM to 300 mMNaCl (table 3).In
stems the soluble protein remained more or less
unchanged up to 50 mMNaCl, above which a gradual
reduction was exhibited. This reduction approached
30% at 300 mMNaCl. In leaves the soluble protein
remained more or less unchanged up to 50 mMNaCl,
there after some reduction in soluble protein content
was obtained. In spikeswhile salinity stress induced a
slight reduction, if any in the soluble protein.
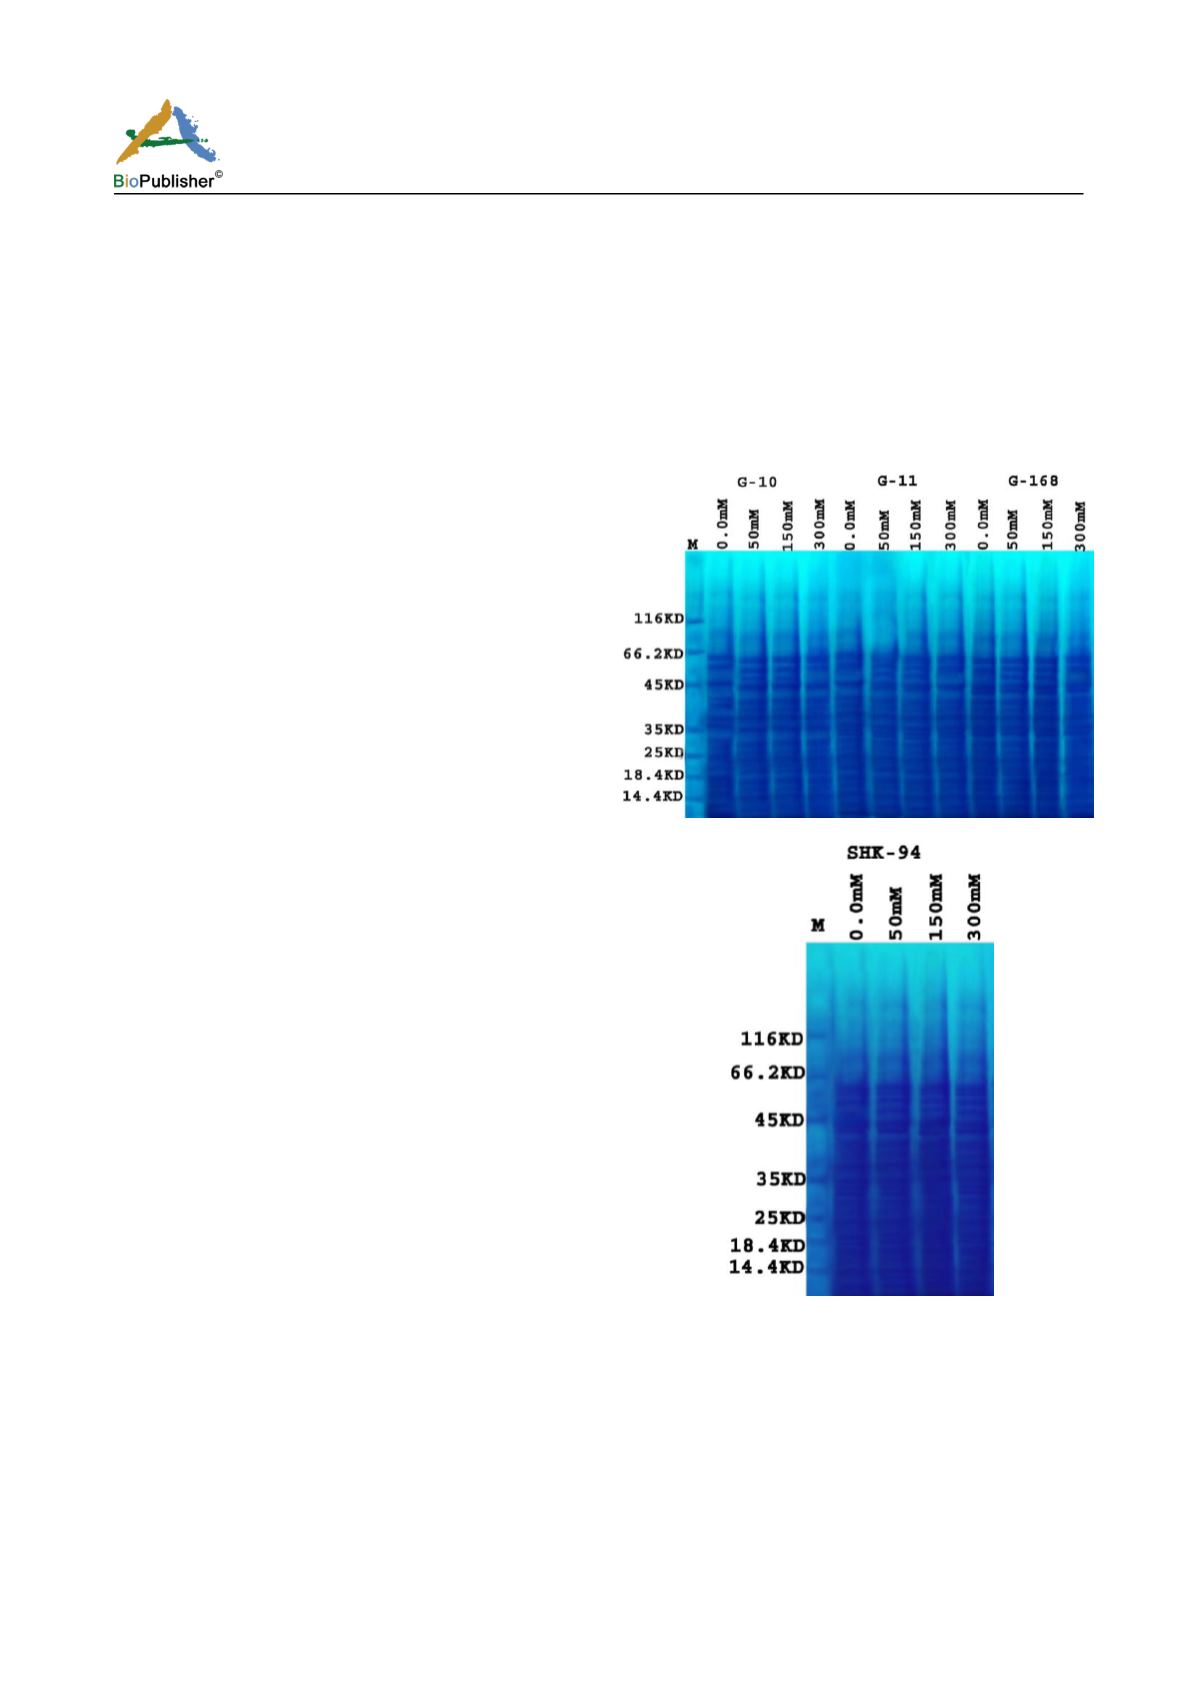
Protein analysis by electrophoresis
The results in table 4 and figure 1 revealed that 23
protein bands were detected in cv. Sakha 94, 20protein
bands in cv. Gimiza 11, 18 protein bands in cv. Gimiza
10 and 21 protein bands in cv. Giza 168. The four
cultivars possessed 17 common protein bands with
molecular weight 63.5KD, 61.6 KD, 57.1 KDa, 47.2
KDa, 42.2 KDa, 38.2 KDa, 37.0 KDa, 35.1 KDa, 28.2
KDa, 26.4 KDa, 24.1 KDa, 20.2 KDa, 17.1 KDa, 16.3
KDa, 15.6 KDa, 12.8 KDaand 10.1 KD.While they
different from each other in 6 protein bands with
molecular weight 52.1 KDa, 44.1 KDa, 33.2 KDa,
32.3 KDa, 18.8 KDa and 14.1 KDa. The 44.1 kDa is
specific marker for both cultivars Sakha 94 and Giza
168. However, the 33.2 KDa is specific marker for cv.
Sakha 94, cv. Gmiza 11 and Giza 168. The 32.3 KDa
is specific marker for cv. Sakha 94 and cv. Gimiza 11.
Studying the pattern of protein synthesis under salt
stress may help to identify a proteins associated with
stress. In the present study, salinity induced the
synthesis of newly proteins and simultaneously
reduced other protein sets (Table 1). The results
revealed that three bands at molecular weight 52.1
kDa is induced under salinity stress in four tested
cultivars Sakha 94, Gimiza 11, Gimiza 10 and Giza
168, as compared to the control treatment. It was
induced at 50 mM, 150 mM in both cultivars Gimiza
11, Gimiza 10 and Giza 168 while, induced at 50 mM,
150 mM and 300 mMNaCl levels in cv. Sakha 94 as
compared to control treatment .This was detected in cv.
Sakha 94 with molecular weight 14.8 kDa at 50 mM
and 150 mMNaCl levels but it disappeared at 300
mMNaCl. This band was absent in the culitvars
Gimiza 11, Gimiza 10 and Giza 168. This result
suggested that this band was specific and responsible
for halo tolerant aracteristic features of cv. Sakha 94
and supported the growth parameters (crop yield),
metabolic constituents and minerals. In addition to
these newly synthesized proteins, salinity stress also
reduced the production of 14.8 in cv. Sakha 94, 52.1
kDa, 44.1 kDa, 18.8 kDa, 14.8 kDa in cv. Gimiza 11,
52.1 kDa, 44.1 kDa, 33.2 kDa, 32.3, 18.8 , 14.8 in cv.
Gimiza 10 and 52.1 kDa, 32.3 kDa, 14.8 kDa protein
in cv. Giza 168kDa, as compared with the control
treatment.
Figure 1 Polyacrylamide gel electrophoresis of soluble protein
profiles separated from wheat cultivars Sakha 94 (SHK- 94),
Gimiza 11 9 (G11), Gimiza 10 (G10) and Giza 168 (G168)
treated with 0.0, 50 mM, 150 mM, 300 mM NaCl levels
1.2.3 Total free amino acids content
The data in figure 2 illustrated that while salinity
stress induced insignificant changes in the amount of
amino acids in roots wheat cultivar Sakha 94. It on the
other hand, induced a considerable activation in the


