International Journal of Marine Science 2015, Vol.5, No.25, 1-9
3
Pazhayar landing center
Pazhayar is situated near the Coleroon debouches into
the Bay of Bengal (Lat. 11°36’N; Long. 79°79’E) on
the Southeast coast of India. There are mechanized
trawlers are operating from this landing center, non –
mechanized boats and Catamarans also engaged in
fishing activities.
Sample collection
Seven different trash fish species were collected
between January, 2011 – March, 2011 from the both
landing centers. Fishes were identified using FAO
sheet and field guides and total lengths were measured
viz,
Thalassoma trilobatum
,
Parapercis heropthalma
,
Saurida tumbil
,
Pseudorhompus javanicus
,
Apogon
quadrifasciatus
,
Priacanthus humrur
and
Stomia
spp.
For each species, five representative sample groups with
similar lengths were taken for the confirmation study.
Determination of metal concentration
The collected fish species were immediately brought
to the laboratory in an ice box and the gills and muscle
of each fish. Muscle and gills were cut into small
pieces and dried at 70
0
C for 15 min. in Microwave
oven (Technico, India). After complete drying,
samples were fine powdered using mortar and pestle
and weighed to 1 g (± 0.01 g) and samples were
digested in 100 ml glass beaker with concentrated
nitric acid (20 ml) overnight. It was then mixed with
10 ml of concentrated nitric and perchloric acid
solution (4:1) followed by hotplate heating at 120
0
C
up to complete dryness. The residue was then
dissolved and diluted with 20 ml of a solution of
deionised water and concentrated nitric acid (4:1) (v:v)
and then this solution is filtered through Whatman
filter paper (11 µm) and metal accumulation levels
were determined by using Inductively Coupled
Plasma Optical Emission Spectrometer (Software –
WinLab 32) (Perkin Elmer, Optima 2100DV). The
precision of the analytical procedure was checked by
analysing
standard
reference
materials
of
commercially available standards (Merck KGCA,
64271 Damstadt, Germany, ICP-Multi element
standard solution IV, 23 elements in nitric acid). All
acids and chemicals were of analytical reagent grade.
Metal concentrations were calculated in microgrammes
per gramme dry weight (µg metal g
-1
d.w.). Two
replicate analyses were made in order to have good
accuracy. All the glasswares were kept overnight in
10 % nitric acid solution and rinsed with deionised
water and air dried before use.
Statistical analysis
Pearson Correlation Coefficient was employed for the
better understanding of relationship between the
concentrations of various metals with various tissue
types using statistical package of SPSS 16.0 for
windows. One way ANOVA was employed to
understand the variation in the concentration of heavy
metals with respect to different species and organs.
Results and Discussion
Fish are at the top of the aquatic food chain and
normal metabolism of fish may accumulate large
amounts of certain metals from water, food or
sediment. However, like essential metals, nonessential
metals are also taken up by fish and accumulate in
their tissues (Yilmaz, et al., 2010). Few reports
described metal residues in wild marine fish species
(Cogun et al., 2006; Storelli et al., 2006).
In the present study, Cd, Co, Cu, Fe, Mg, Mn, Ni, Pb,
Zn, Al, Cr and B concentrations
(
µg g
-1
dry wt) were
determined in the trash fishes (gill and muscle tissues).
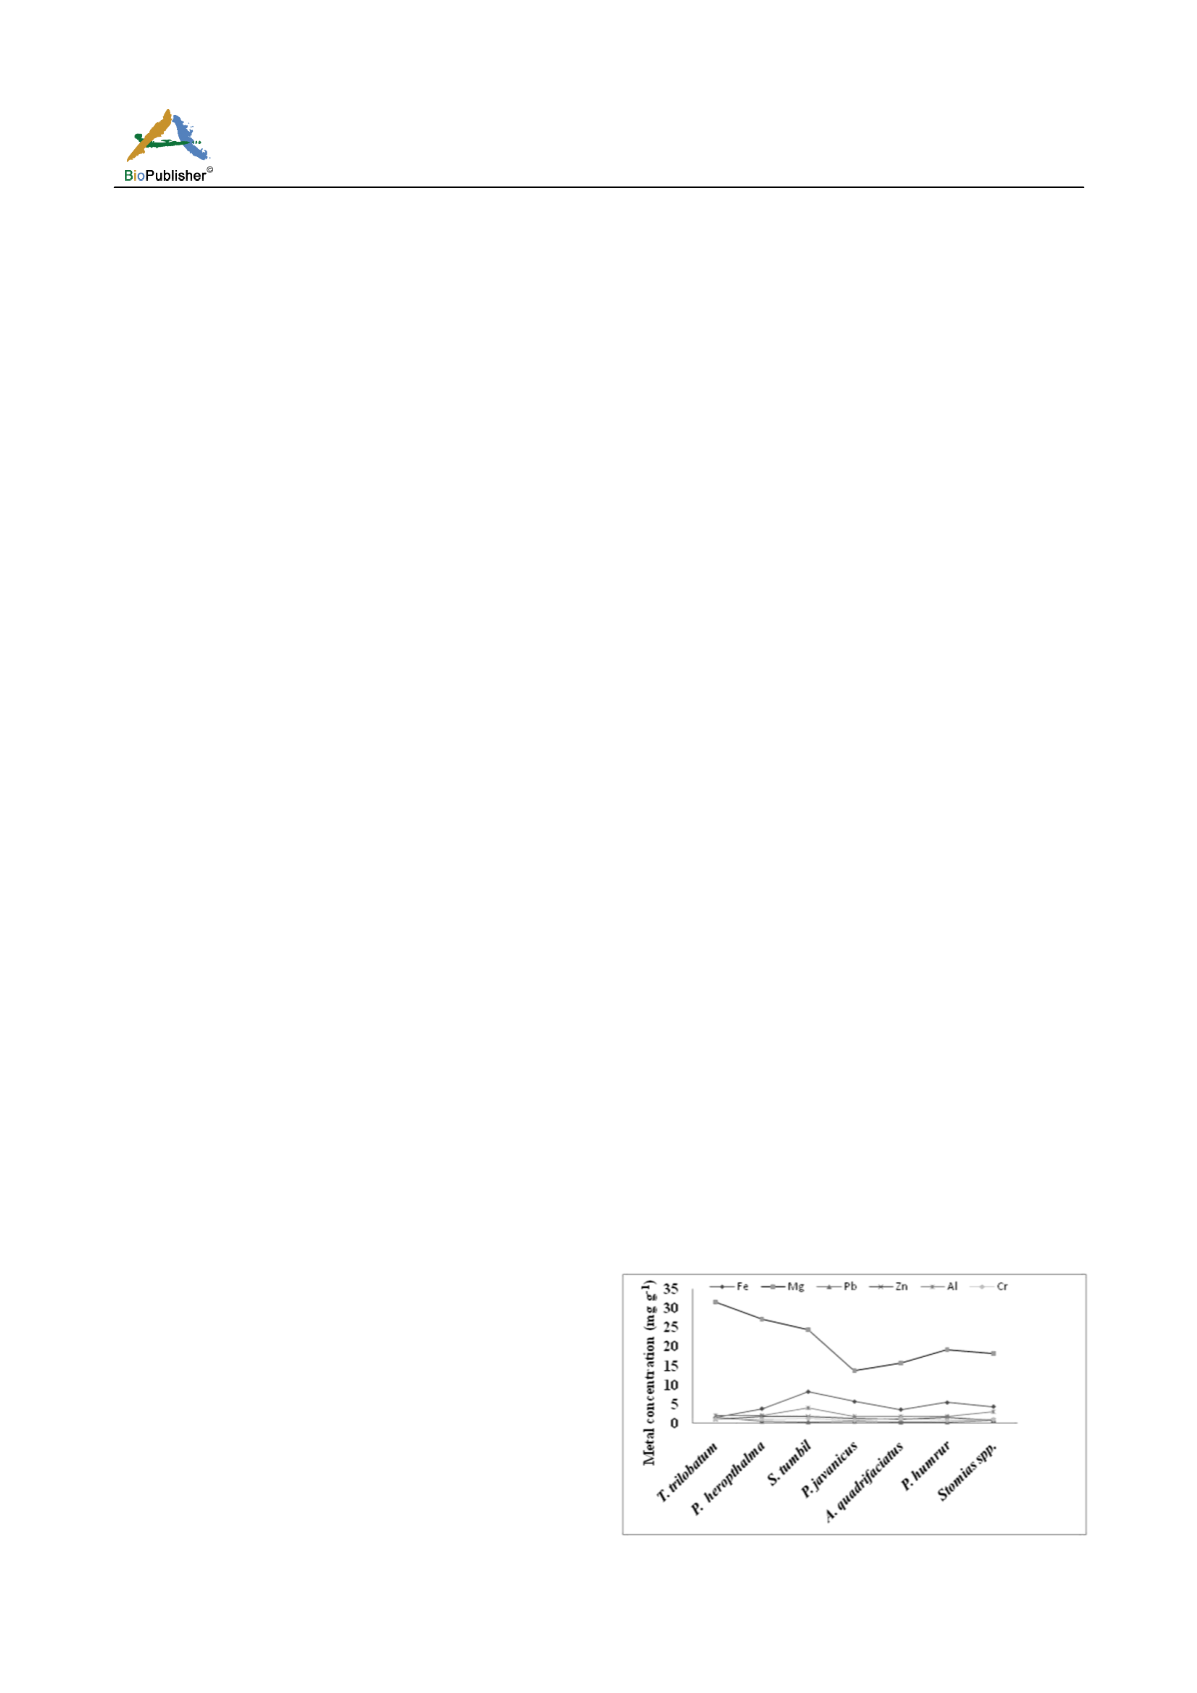
The distribution of heavy metal concentrations in
tissue samples, collected from different species of the
Cuddalore and Pazhayar coast are given in Figure 2
a-b and 3 a-b. Metals were found with significant
variations in their concentrations with respect to fish
species. The Pazhayar fish samples showed lower
concentrations for majority of metals than Cuddalore
trash fish samples. Concentration of Co was found
below detectable level (BDL) in three out of seven
tested fishes in each station. In the present study
twelve metals were studied, concentrations of all trace
metals are given in Table 1-2. Distribution graph of
the heavy metals clearly indicated the variation in the
concentrations of different metals (Figure 2a-b and
3a-b). Concentration of each metal varied significantly
in each species (one way ANOVA
P<
0.05).
Figure 2a Levels of Fe, Mg, Pb, Zn, Al and Cr (µg g
-1
) in fishes


