International Journal of Marine Science 2015, Vol.5, No.25, 1-9
6
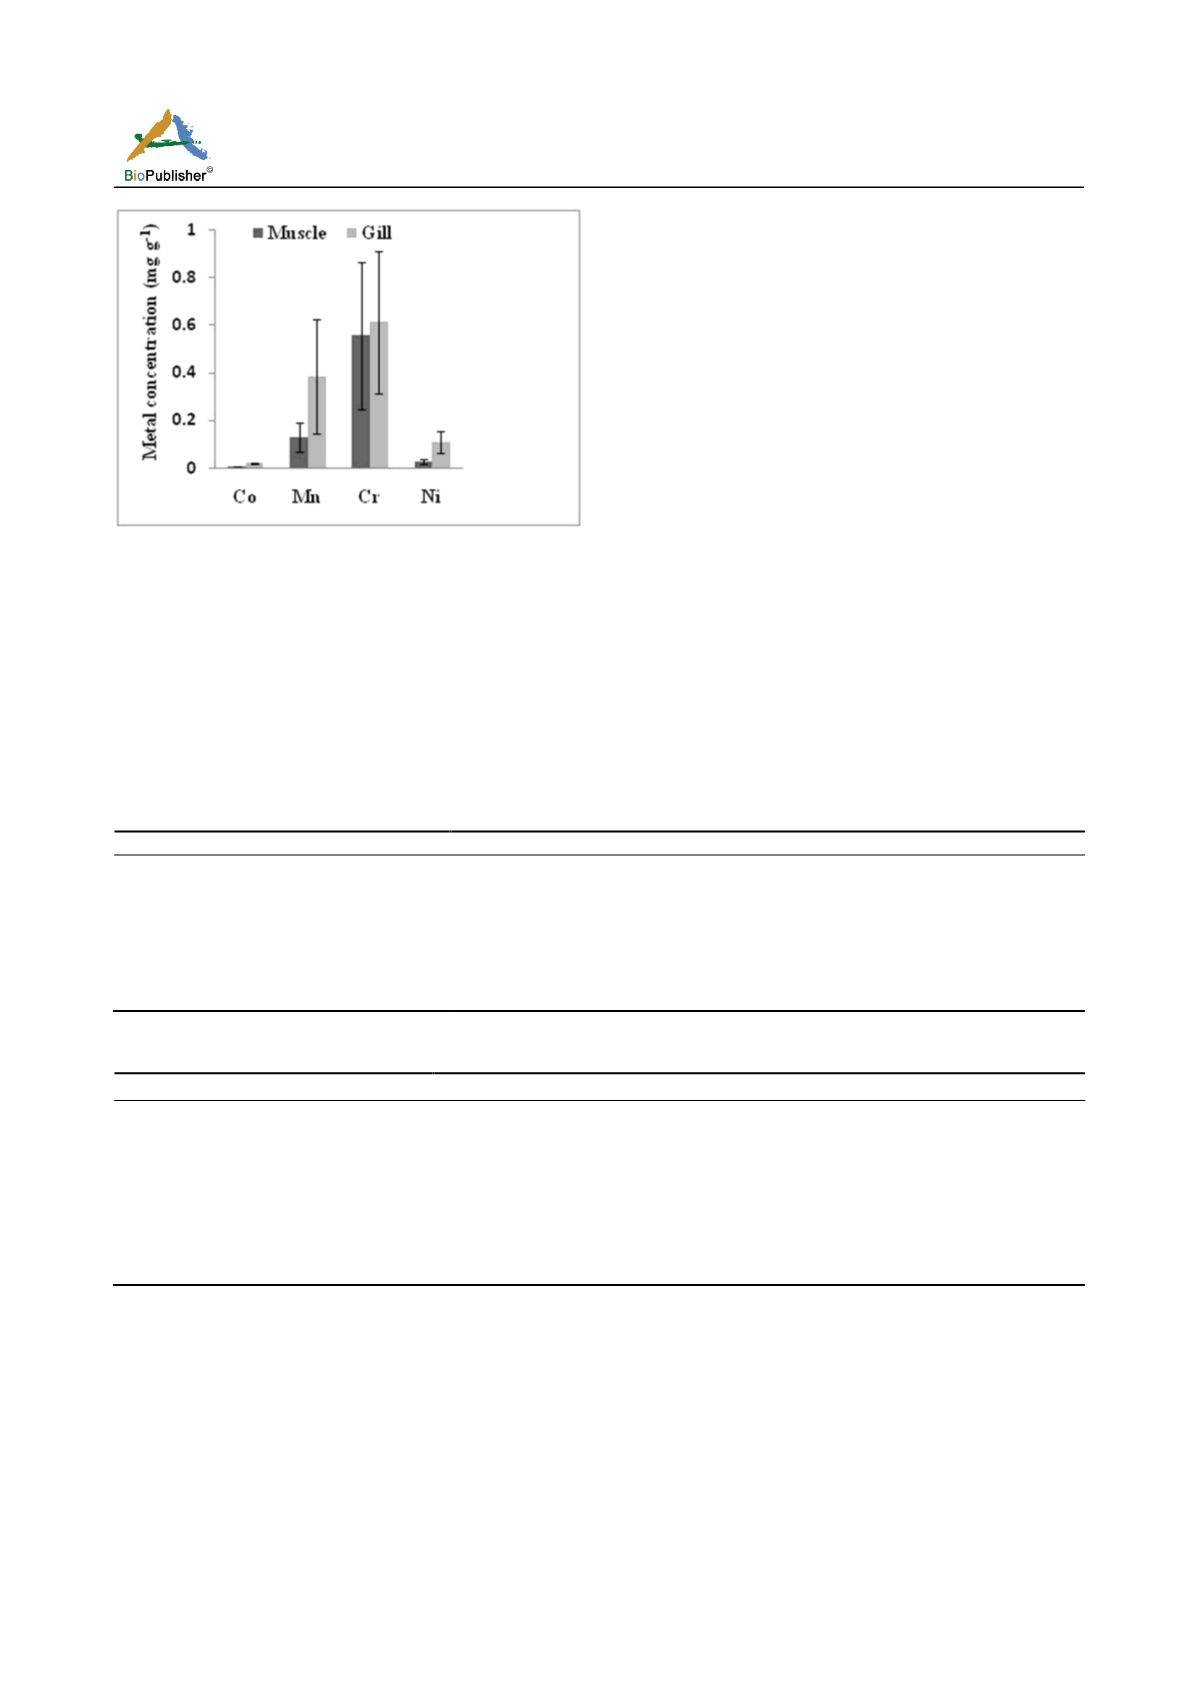
Figure 5c Comparison of mean concentrations (± SD) of Co,
Mn, Cr, and Ni (mg g
-1
dry wt) between muscle and gill tissues
of fishes. Bars represent mean and vertical lines the SD
permissible limits recommended by FAO/WHO,
(1976). These values are higher than the earlier reports
(Ashraf et al., 1991: Tariq et al., 1994 and
Vijayakumar et al., 2011) but lower than the
permissible limits. Mendil et al. (2010) have reported
0.11 to 0.75 µg g
-1
cadmium in fish species from
Yesilirmak river and it is coincide with the present
study.
Concentrations of Cu in the fish samples were
between 0.06 and 0.37 µg g
-1
and it is lower than the
permissible limit. The maximum level of copper was
observed in gill of
Saurida
tumbil
and minimum in
Thalassoma
trilobatum
muscle. Mendil et al. (2010)
and Dhaneesh et al. (2012) reported the values for Cu
were 1.0-2.5 µg g
-1
and 0.98±0.22 µg g
-1
respectively
and the present results were lower than these values
and similar to Vijayakumar et al. (2011) (0.42-0.61 µg
g
-1
). As copper is an essential part of several enzymes
and necessary for synthesis of heamoglobin, most
marine organisms have evolved mechanisms to
regulate the concentrations of this metal in their tissues.
According to Turkish Food Codex the maximum
copper level permitted for fishes is 20 mg/kg
(Ananymous, 2002).
Table 3 Order of mean metal concentration in the low value trash fishes of Cuddalore (polluted area)
Species
Metal concentration
Thalassoma trilobatum
Mg> Al> Fe> Pb> Cr> Zn> B> Cd> Mn> Ni> Cu> Co
Parapercis heropthalma
Mg> Fe> Al> Zn> Cr> B> Pb> Cd> Cu> Mn> Ni> Co
Saurida tumbil
Mg> Fe> Al> Zn> Cr> B> Ni> Cd> Cu> Mn> Pb> Co
Pseudorhompus javanicus
Mg> Fe> Al> Zn> B> Cr> Pb> Cu> Cd> Mn> Ni> Co
Apogon quadrifasciatus
Mg> Fe> Al> B> Cr> Zn> Ni> Cd> Cu> Pb> Mn> Co
Priacanthus humrur
Mg> Fe> Al> Zn> B> Cr> Cu> Pb> Cd> Mn> Co> Ni
Stomias
spp.
Mg> Fe> Al> Zn> Cr> Pb> B> Ni> Cu> Cd> Mn> Co
Table 4 Order of mean metal concentration in the low value trash fishes of Pazhayar (unpolluted area)
Species
Metal concentration
Thalassoma trilobatum
Mg> Fe> Zn> Al> B> Cr> Pb> Mn> Cd> Ni> Cu> Co
Parapercis heropthalma
Mg> Fe> Al> Zn> Pb> Cr> B> Cu> Mn> Cd> Ni> Co
Saurida tumbil
Mg> Fe> Al> Zn> Cr> Mn> B> Cu> Pb> Cd> Ni> Co
Pseudorhompus javanicus
Mg> Fe> Al> Zn> Cr> B> Pb> Mn> Cu> Cd> Ni> Co
Apogon quadrifasciatus
Mg> Fe> Al> Zn> Cr> Mn> B> Pb> Cu> Cd> Ni> Co
Priacanthus humrur
Mg> Fe> Al> Zn> Cr> B> Mn> Cu> Pb> Cd> Co> Ni
Stomias
spp.
Mg> Fe> Al> Zn> Cr> Mn> B> Cu> Pb> Cd> Ni> Co
The concentration of cobalt was found to be 0-0.32 µg g
-1
and it is high in gill tissues and below detectable level
(BDL) in the muscle. Turkmen et al. (2008) have
investigated Co levels in fish samples and they found
higher concentration (0.04-0.41 mg kg
-1
) than the
present study. Turkmen et al. (2005) reported that cobalt
concentration varied between 0.73 and 1.91 mg/kg
-1
in
the muscles of fishes of the Iskenderun Bay and lower
Co levels in fish muscles (<0.001-0.002mg/kg
-1
) have
been reported from the Mediterranean Sea region.
These levels are in good agreement with our values.
Cobalt is an essential nutrient for man and is an
integral part of vitaminB
12
. Underwood (1977)
reported that the average daily intake of cobalt, in all
forms, ranges 0.30-1.77mg/day. Cobalt has also been
implicated in blood pressure regulation and has been
found to be necessary for proper thyroid function
Blakhima (1970).


