International Journal of Marine Science 2015, Vol.5, No.22, 1-6
5
Tables 3 T test result of microalgae cell abundance and the number of microalgae species between research station from Tallo Estuary
(*: P < 0.1; **: P < 0.05 and ***: P < 0.01; ns : not significant)
Pair Test
Significant Value
Abundance of microalgae cell
Richness of microalgae
Mangrove area vs Industrial area
0.592 ns
0.016**
Mangrove area vs Mid area of estuary
0.281 ns
0.03*
Industrial area vs Mid area of estuary
0.55*
0.42 ns
The highest number of genera/species was found in
station of industrial area of estuary was 12 genera.
Whereas the lowest number of species was found
in mid area of estuary. Statistically, there was a
significant difference of species number between
mangrove area and industrial area of estuary and
mangrove area and mid area of estuary. Whereas
the number of species between industrial area and
mid area of estuary was not differ significantly
(Tables 3).
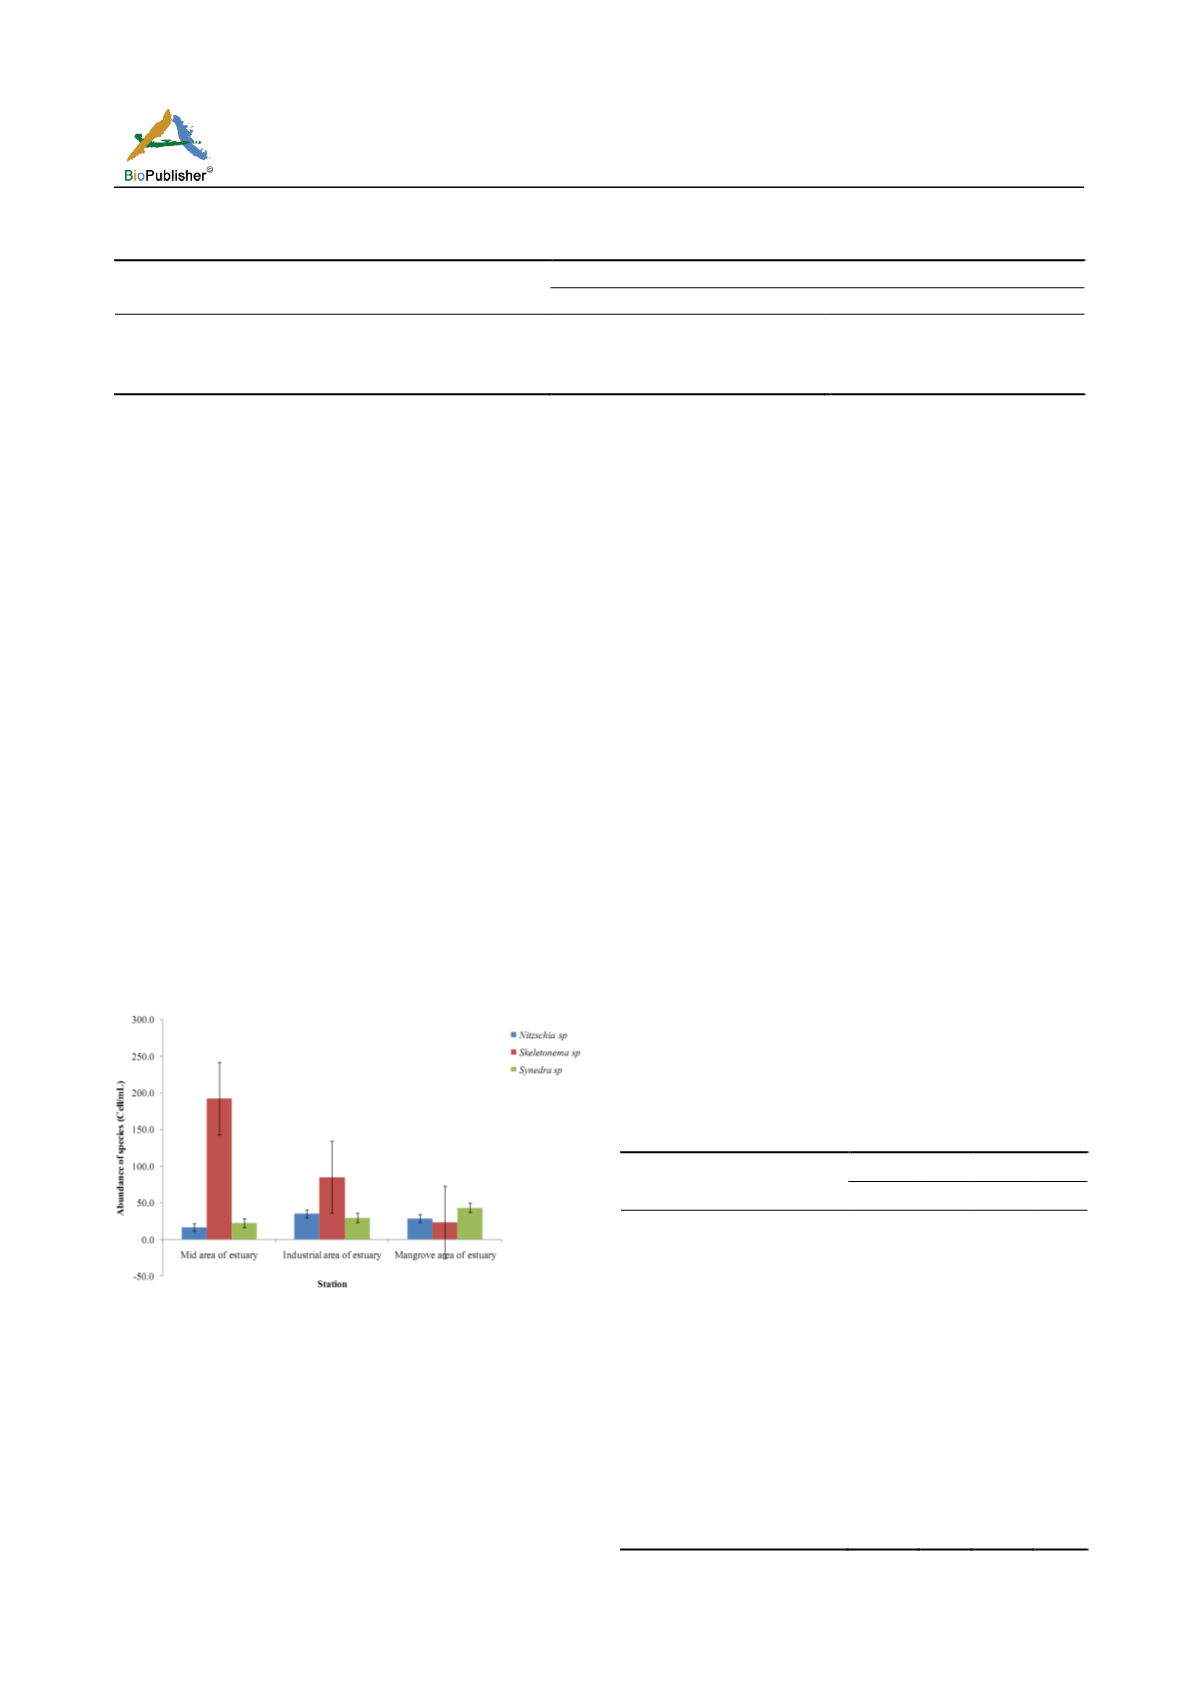
There were three types of microalgae that predominate
at three research stations, such as
Skeletonema sp,
Nitzchia sp
and
Synedra sp
. Abundance of the three
type of microalgae varied in every research station
(Figure 4). Skeletonema sp was the most abundance at
mid area of estuary with the average of abundance
account for 192 cell/ml, whereas for others two
species of microalgae the average of abundance was
less than 50 cell /ml.
Figure 4 The average of three microalgae dominant (±SE, N= 9)
in every research station from Tallo Estuary
2.4 Relationship between heavy metal concentration
with abundance and microalgae dominant
Reggression analysis Result between concentration 3
type of heavy metals (Pb, Cu and Cr) in sediment and
water column with abundance of three microalgae
species dominant (
Nitzchia sp, Skeletonema sp and
Synedra sp
) indicated that just a few regression pair
that had R
2
value bigger than 0.5 (Tables 4). This
condition indicated that microalgae that predominated
in Tallo River Estuary had a weak correlatin between
concentration of heavy metal that existed in the
sediment and in the water. Even though, from this
regression result also can be known that there was
quite strong regression between heavy metal
concentration in the water and particular species, with
the R
2
value = 0.915 for regression between Cu and
Nitzchia sp
. Chromium (Cr) had very strong
regression and differ significantly with
Skeletonema
sp
and
Synedra sp
. This result indicated that some
species of microalgae showed a different response to
existence of heavy metal in the water column. This
result in accordance with research that conducted by
Folgar (2008) concentration of heavy metal in the
culture media. They also found that species of
Chlorococcum sp
and
Tetraselmis gracilis
grew was
pursued by existence of Cd with concentration of
2.5 – 3 mgs/L and 5.0 mgs/L.
Tables 4 Regression analysis result of 3 heavy metals
concentration in the sediment and in the water with
abundance and microalgae dominant from Tallo River Estuary
(* : R
2
> 0.5)
Pair Test
Sediment
Water
R
2
F-Sig R
2
F-Sig
Pb vs Richness of microalgae 0.126
0.769 0.997* 0.035
Cu vs Richness of microalgae 0.354
0.595 0.202 0.703
Cr vs Richness of microalgae 0.754* 0.330 0.999* 0.005
Pb vs
Nitzchia sp
0.886* 0.219 0.421 0.55
Cu vs
Nitzchia sp
0.050
0.856 0.915* 0.189
Cr vs
Nitzchia sp
0.772* 0.219 0.484 0.509
Pb vs
Skeletonema sp
0.237
0.677 0.0001 0.993
Cu vs
Skeletonema sp
0.222
0.687 0.279 0.646
Cr vs
Skeletonema sp
0.867* 0.237 0.993* 0.053
Pb vs
Synedra sp
0.030
0.889 0.114 0.781
Cu vs
Synedra sp
0.539* 0.475 0.049 0.857
Cr vs
Synedra sp
0.579* 0.449 0.039* 0.159


