International Journal of Marine Science, 2016, Vol.6, No.21, 1-20
12
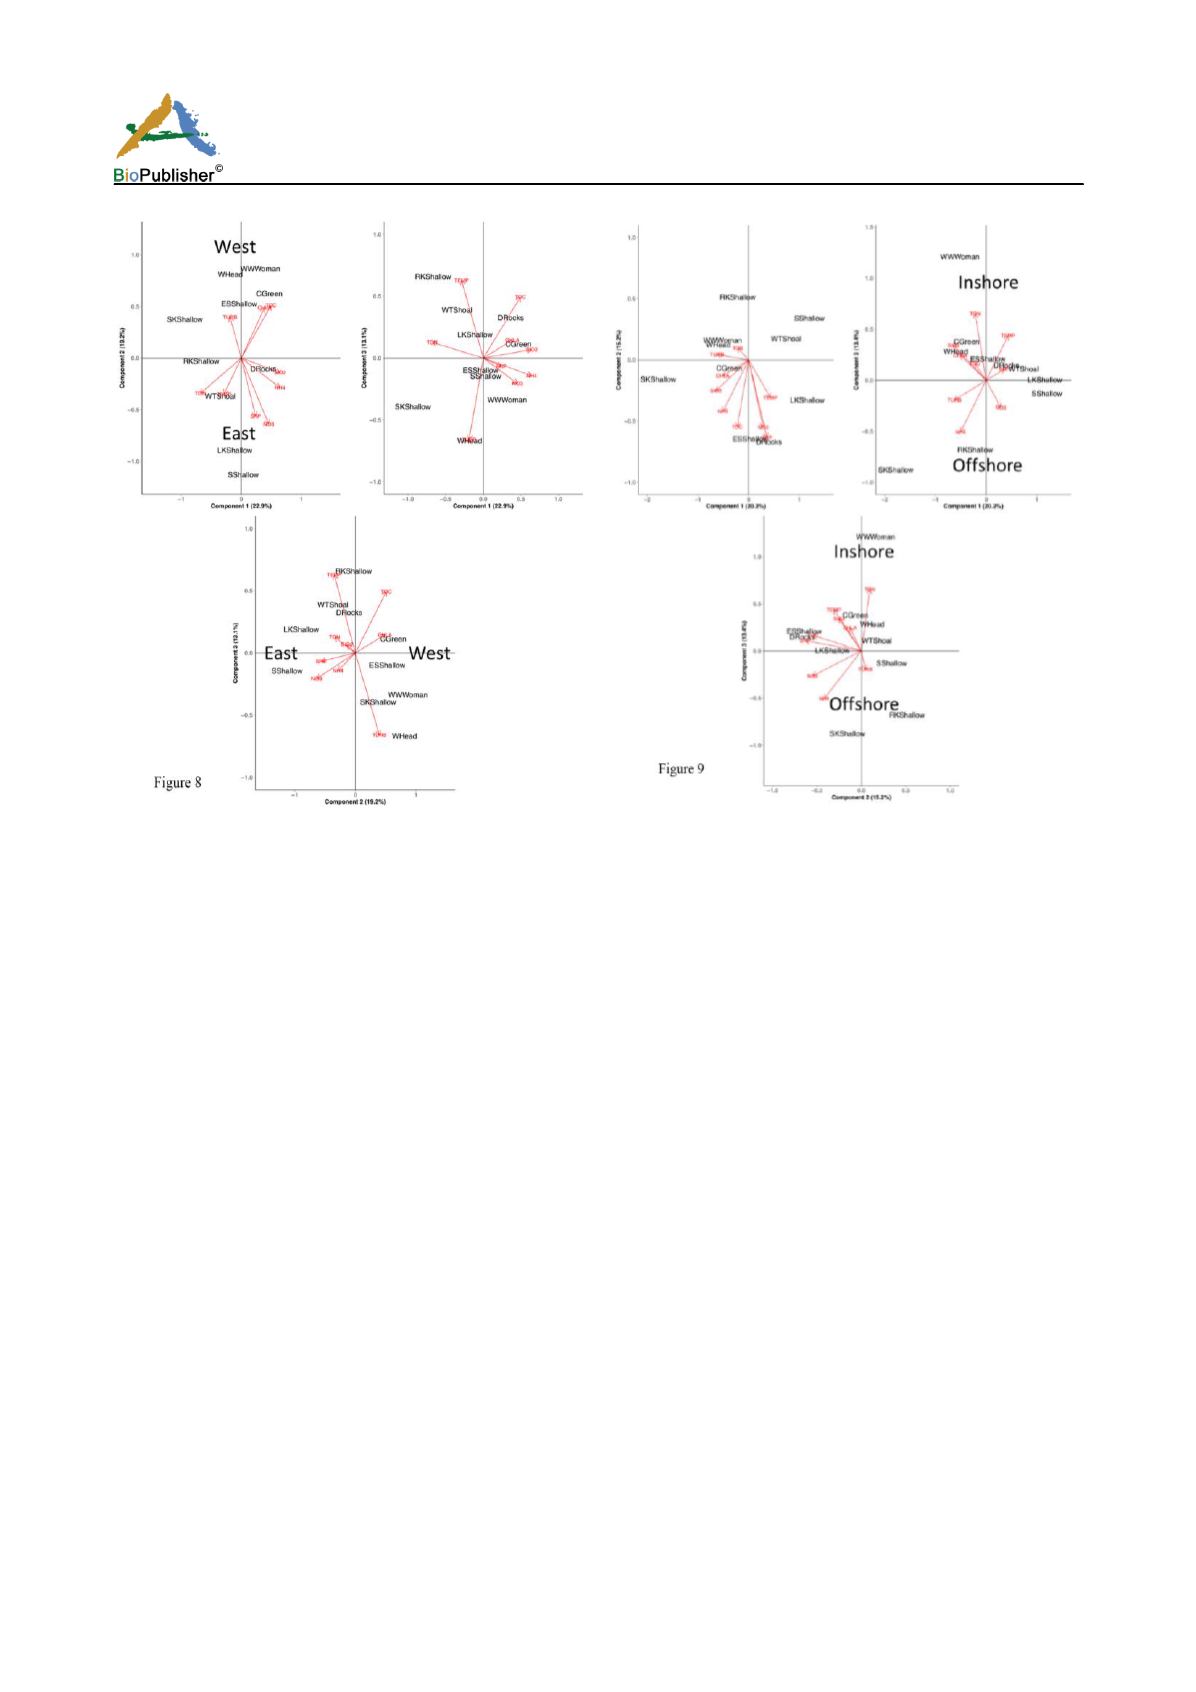
Figure 8. Principal component bi-plots of winter environmental data from patch reef and offshore reef sites from 1996-2011. Three
bi-plots represent combinations of the first three components representing 55% of the variation in the dataspace; component
1-component 2 (A), component 1-component 3 (B), and component 2-component 3 (C). Site names are positioned at the score
associated with that site. Red arrows indicate the loading of a given environmental variable on the ordination of sites. The length and
direction of the arrow is proportional to its effect.
Figure 9. Principal component bi-plots of summer environmental data from patch reef and offshore reef sites from 1996-2011. Three
bi-plots represent combinations of the first three components representing 48.8% of the variation in the dataspace; component
1-component 2 (A), component 1-component 3 (B), and component 2-component 3 (C). Site names are positioned at the score
associated with that site. Red arrows indicate the loading of a given environmental variable on the ordination of sites. The length and
direction of the arrow is proportional to its effect.
Principal component analysis of summer WQMP data indicated 48.8% of the environmental variability among all
sites could be explained by the first three components (Figure 9). Similar to PCA of winter months, regional
ordination of sites was evident during the summer (Figure 9). The three speciose western sites Western
Washerwoman, Cliff Green, and Western Head ordinated away from the eastern sites Sand Key, Rock Key and
Sombrero Reef, and Looe Key, while the remaining sites, Eastern Sambo, Western Turtle Shoal, and Dustan
Rocks were found between these two groups. This separation was not as distinct as that identified during winter
months and may provide an indication of the large potential for site or location dependent environmental
variability during summer months for reefs of the middle and lower Florida Keys.
Despite explaining only 13.3% of the total variation, PC3 appeared largely responsible for the regional ordination
of sites within the data-space (Figure 9). Clear ordination was evident only in bi-plots including this component as
an axis (Figure 9A, B). Therefore the environmental variables TON, ammonium, and SWT, which were most
influential along PC3, may be important factors governing summer environmental differences between these
regions and sites. Upon closer inspection, SWTs did not vary significantly between regions, however inshore sites
were significantly warmer than offshore sites by 1°C (ANOVA; p = 0.0183). Further, SWT at inshore sites was
consistently warmer during summer months (32-27°C), while offshore site SWTs were typically cooler but also


