International Journal of Marine Science, 2016, Vol.6, No.21, 1-20
6
1980). The first three principal component axis were visualized in biplots to display how particular abiotic factors
influenced the grouping of sites.
Ad-hoc contrasts were used to identify differences between transplant groups, within a general linear model
framework. Contrasts included (1) month dependent shifts in brightness between corals transplanted to and from
the site of origin and (2) site and transplant dependent shifts in the mean brightness of a species. Seasonal patterns
in mean brightness were identified with trigonometric linear modeling, applying a period of 12 to accommodate
our monthly data interval.
3 Results
3.1 16-Year Comparison of Coral Communities
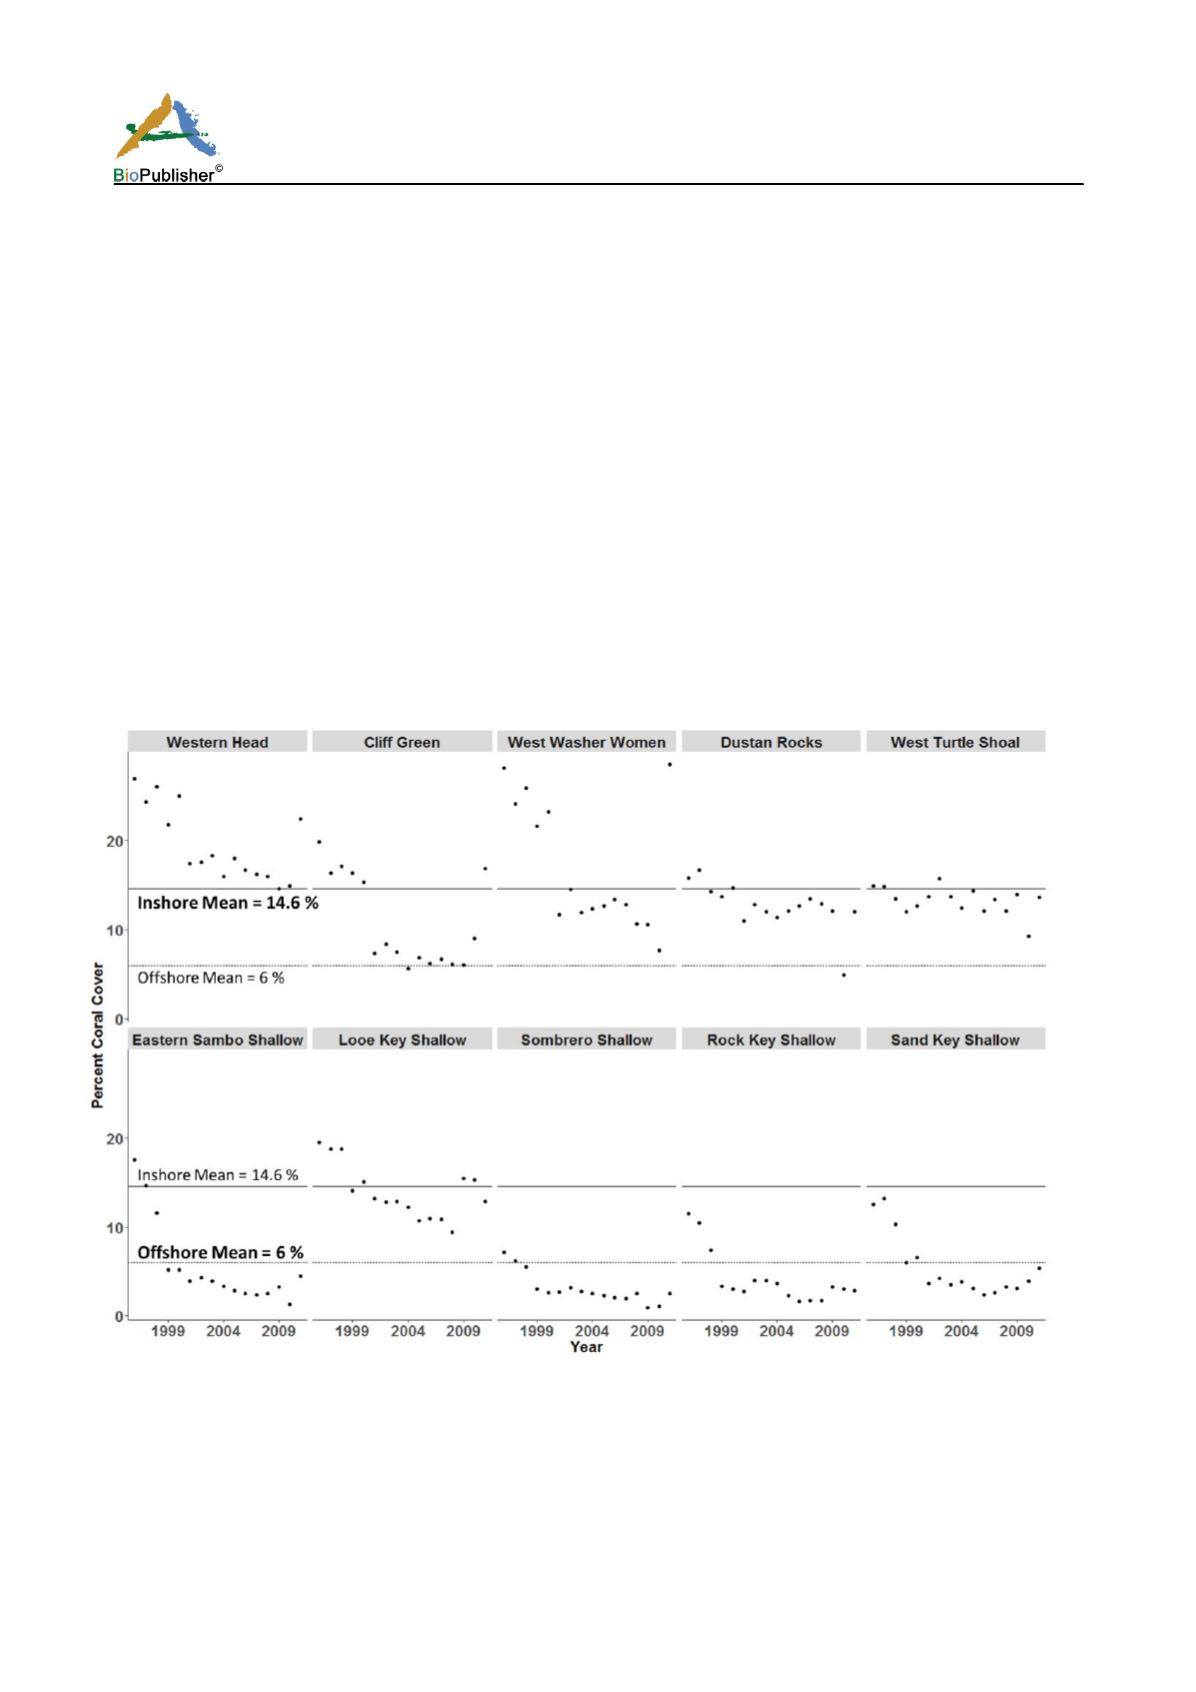
Analysis of the CREMP dataset revealed that coral cover declined at 8 of 10 reefs between 1996 and 2011 (Figure
2). Decreases in coral cover were greatest between 1999 and 2000. Coral cover declined from 25-15% at the three
western-most inshore sites (Western Head, Cliff Green, and West Washerwoman) between 1999 and 2000
followed by a marginal rate of decline or stability in the remaining coral cover. The eastern most sites, Dustan
Rocks and Western Turtle Shoal, maintained coral cover during this period while coral cover at all offshore bank
reef sites decreased significantly between 1996 and 2000. Despite similar trends of coral cover loss, the total mean
coral cover was significantly greater at the monitored inshore patch reefs compared to offshore bank reefs
(RM-ANOVA: p < 0.0001).
Figure 2. Annual percentage (%) of scleractinian coral cover from 1996-2011. Offshore shallow reef sites are grouped along the top
row while inshore patch reef sites are grouped along the bottom row. The solid line is the mean across all years for inshore sites
(14.6% coral cover) while the dotted line is the mean for offshore sites (6% coral cover). See figure 1 for site locations.
In addition to the significant differences in coral cover, we identified community dissimilarities between offshore
and inshore reefs. Species richness was significantly greater at the inshore sites (ANOVA: p < 0.05), with 9
additional species present when rare species were considered. Removing species accounting for less than 0.1% of


