Basic HTML Version


International Journal of Marine Science 2014, Vol.4, No.44, 1-14
http://ijms.biopublisher.ca
6
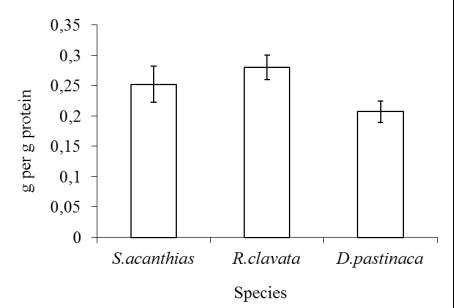
Figure 5 Albumin concentration (mean ± SE) in the liver of
elasmobranch species caught in Sevastopol Bay (Black Sea,
Ukraine)
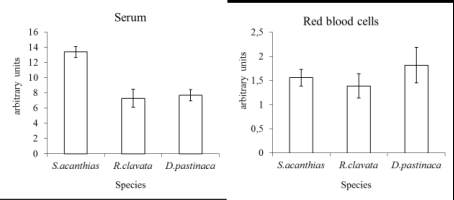
3.3 Blood and serum biomarkers
Oligopeptide concentrations in RBCs of examined
elasmobranchs varied insignificantly while in serum
the level was greater in dogfish (P<0.001) than in
either skate species (Figure 6).
Figure 6 Oligopeptides concentration (mean ± SE, ×10
-3
mg
protein
-1
) in the serum and red blood cells of elasmobranch fish
species caught in Sevastopol Bay (Black Sea, Ukraine)
Antioxidant enzyme activities in RBCs of tested
elasmobranch species are presented in Figure 7. SOD
activity was significantly higher (P<0.001) in both
skates as compared with the dogfish. SOD activity
was similar in buckler skate and in stringray. CAT
activity was very low in dogfish and in several
individuals we did not detect CAT activity in RBCs.
CAT activity in RBCs was insignificantly greater in
buckler skate than in stringray. PER and GR activities
were higher in the dogfish as compared with both
skates (P<0.001). No significant differences were
documented between the two species of skate. Overall,
RBC antioxidant enzymatic activities were higher in
skates than in shark at the case of SOD and CAT, PER
and GR activity was higher in dogfish. The differences
between the two species of skate were less than between
shark and skates, with the exception of CAT activity.
Figure 7 Antioxidant enzyme activities (mean ± SE., mg
protein
-1
min
-1
) in the red blood cells of elasmobranch fish
species caught in Sevastopol Bay (Black Sea, Ukraine)
High negative correlations were observed between
SOD and PER (r=-0.98), SOD and GR (r=-0.98) and a
positive relationship was shown between PER and GR
activities (r=0.91).
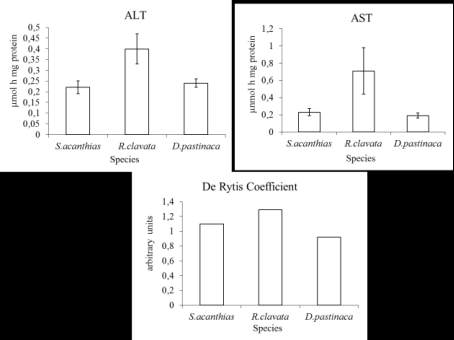
Serum ALT and AST activities were significantly
higher (P<0.01) in buckler skate as compared with
stringray and dogfish. Enzyme activities were the
similar in stringray and shark (Figure 8). Values of de
Rytis coefficient varied insignificantly in tested
elasmobranch species. High correlation was shown
between serumALT and AST levels (r=0.94).
Figure 8 Aminotransferase activities and de Rytis coefficient
(mean ± SE, mg protein
-1
h
-1
) in the serum of elasmobranch
fish species caught in Sevastopol Bay (Black Sea, Ukraine)
Serum albumin concentrations in dogfish and
stringray was lower than in buckler skate (P<0.01)
(Figure 9). Hemoglobin concentrations were similar in
all tested elasmobranch species.